GIS in Water Resources
Fall 2010
Prepared by Tim Whiteaker, Jingqi Dong, Fernando
R. Salas, David R. Maidment
Center for Research in Water Resources
The University of Texas at Austin
Computer and
Data Requirements
Participating
in the Open Source Community
Downloading
Streamflow for the San Marcos River Basin
Preparing
the Map for Printing
Creating and
Printing a Layout
In order to improve their understanding of the environment, water resources engineers use measurements of variables like temperature and flow rate that are measured through time. By analyzing these time series of data, they can spot trends and make inferences about how a hydrologic system responds to events like storms or construction in a sensitive watershed. Critical to this analysis is the ability to find time series data and put them in a spatial context.
HydroDesktop is a free and open source Hydrologic Information Systems (HIS) application that helps users discover, use, and manage hydrologic time series data. It includes data query, download, visualization, graphing, analysis and modeling capabilities. HydroDesktop use open source GIS components called DotSpatial and and open source relational database called SQLite to provide an information base with which users can efficiently collect and synthesize large quantities of hydrologic data. HydroDesktop is designed to exploit the utility of WaterOneFlow Web services developed by the Consortium of Universities for the Advancement of Hydrologic Science, Inc. (CUAHSI) Hydrologic Information Systems project (CUAHSI-HIS). The result is a spatially-enabled system that facilitates the aggregation of time series of observational data describing the water environment.
Related
Links:
HydroDesktop - http://hydrodesktop.codeplex.com/
CUAHSI Hydrologic Information System - http://his.cuahsi.org/
DotSpatial - http://dotspatial.codeplex.com/
Goals
and Objectives
The goal of this exercise is to introduce you to the tools and functions available in HydroDesktop that allow you to search for and synthesize hydrologic time series data in an area of interest. This exercise will teach you how to find and obtain streamflow data in Texas, visualize the data and then finally communicate your findings in a printable layout.
Objectives for this exercise include:
· Find where streamflow is measured in Texas.
· Download streamflow for a watershed in Texas.
· Visualize time series data in tables and graphs.
· Export time series data for use in other programs.
· Create a printable map and graph to communicate your results.
HydroDesktop is currently designed to run only on a Windows operating system such as Windows XP or Windows 7. To carry out this exercise, you will need the latest version of HydroDesktop, which is HydroDesktop 1.1 Beta RC6 at the time of this writing. Because HydroDesktop’s functionality continues to grow, the installer is periodically updated. Check back often for the latest version of HydroDesktop. You will also need an Internet connection since you will be accessing live online data.
It is expected that you will do this exercise on your own computer. Because the software is still being evolved, it is not installed in the computer labs being used for ArcGIS in this course, and you will not be able to install it there because you do not have administrator privileges on the laboratory computers.
To
install HydroDesktop:
1. In a Web browser, navigate to http://www.hydrodesktop.org (this converts automatically to http://hydrodesktop.codeplex.com/ ).
2. Click the Download link on the right to download the installer for version 1.1 Beta RC6, as shown below.
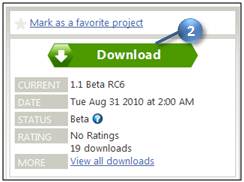
Figure 1 The HydroDesktop Web site has the latest installer
3. Read the license and agree to it.
4. Save and run the installer, accepting all defaults. The installer will guide you through the rest.
IMPORTANT
At the time of this writing, HydroDesktop is still in the beta stages of
software development and thus still contains bugs that may cause it to crash.
It is highly recommended that you follow the procedure in this exercise very
carefully and in one sitting in order to complete the assignment. However, once
you are finished with the requirements for the exercise, you are encouraged to
experiment with the program and be creative.
HydroDesktop is an open source product, which means that anyone can see the source code used to create the program and contribute to its development. Even if you aren’t a programmer, you can still participate in the discussion forums and post bugs or feature requests in the issue tracker.
The home for HydroDesktop is on CodePlex, a Web site for open source software. To add to the discussions or post a bug, you must first register for your free CodePlex account. Alternatively, you can use the account that has been set up for the class. The username for the class account is cuahsiuser. The password will be provided in class.
Once you have a CodePlex account, you can log in at http://hydrodesktop.codeplex.com/ and start to contribute. The community is really what drives open source software development, so this is an exciting opportunity to make your voice heard!
You are encouraged to provide feedback on any issue or problem you may encounter throughout this exercise. Feel free to utilize online resources such as the issue tracker on the HydroDesktop Web site when providing feedback. In this exercise you’ll learn how to access these resources directly through HydroDesktop.
Suppose you have been commissioned with protecting the water environment
of the San Marcos River Basin in Texas.
To get a sense of the hydrology of this region, you’ll want to find
information such as how much water flows through the rivers or how much water
is available in the groundwater system.
In this exercise, you’ll use HydroDesktop to download streamflow data in
this basin and create a map of the result.
Let’s open HydroDesktop and get to know its user interface.
1.
Open HydroDesktop if it is not already open (Start
/All Programs / CUAHSI HIS / HydroDesktop /HydroDesktop).
![]()
Please note that if you already have an installed version of HydroDesktop on your computer you should uninstall it before trying to install a new version.
IMPORTANT
Do not maximize other windows in front of HydroDesktop while it opens. This is a known bug that can cause
HydroDesktop to freeze. If it freezes,
right click HydroDesktop in the Windows task bar and choose to end the program.
2. Maximize the window within your computer screen. This is recommended so that you can more easily view all of the features in HydroDesktop.
3.
Take a moment to explore the user interface.
As you can see below, HydroDesktop looks much like a typical GIS interface. It supports complex layer symbologies, adding your own shapefiles to the map, and custom programmed tools and plugins. It even comes with some basemap shapefile data which are already added to the map. What sets HydroDesktop apart from other GIS applications, is the ability to query for hydrologic time series data.
Notice that HydroDesktop presents many of its controls on a ribbon, much like modern versions of Microsoft Office. The ribbon is organized into tabs which contain groups of buttons and tools. There is also an orb for accessing basic functions like saving and printing.
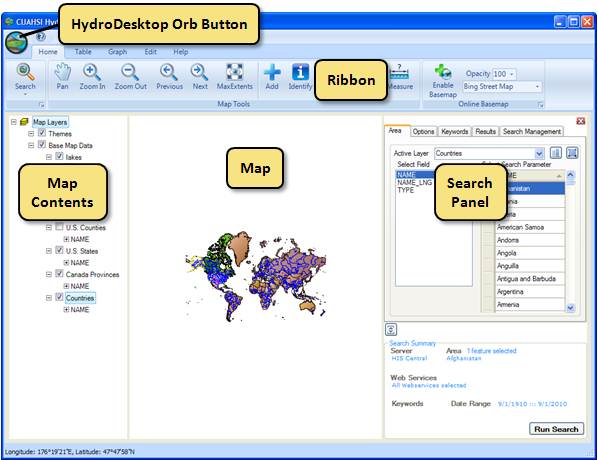
Figure 2 HydroDesktop User Interface
If you have comments or issues as you work through this exercise, you can find helpful resources on the Help tab. The buttons on this tab let you view documentation, jump to the discussion forums or issue tracker, email for help, or submit a comment.
4. Click the Help tab in the ribbon to view the buttons available on that tab.
5. Click the Issues button to open the issue tracker on the HydroDesktop Web site. This is a list of known issues or bugs that need fixing in the software. If you’d like to contribute an Issue, Click on the Forum button and Create a Discussion by logging in as cuahsiuser with password cuahsi.user
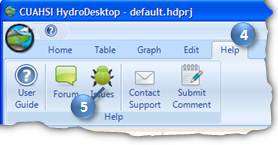
Figure 3 Using the Help Tab To Open the Issue Tracker
6.
 Talk to
Yoori!! CUAHSI HIS has a real , live
support person called Yoori Choi, who works in the CUAHSI Program Office. You can use the Help tab options Contact Support to send an email to
Yoori, or you can Submit a Comment
if you’d just like to make a general suggestion as to how the software or
CUAHSI HIS process could be improved.
Yoori will take all these comments and suggestions and help the HIS
development team to figure out how to use them to improve HydroDesktop and our
web services. You can reach Yoori
directly at ychoi@cuahsi.org.
Talk to
Yoori!! CUAHSI HIS has a real , live
support person called Yoori Choi, who works in the CUAHSI Program Office. You can use the Help tab options Contact Support to send an email to
Yoori, or you can Submit a Comment
if you’d just like to make a general suggestion as to how the software or
CUAHSI HIS process could be improved.
Yoori will take all these comments and suggestions and help the HIS
development team to figure out how to use them to improve HydroDesktop and our
web services. You can reach Yoori
directly at ychoi@cuahsi.org.
HydroDesktop manages your work within projects. A HydroDesktop project file (.hdprj) contains information about what geospatial layers you have in your map and how those layers are symbolized. These layers are stored in shapefiles, a widely available GIS data format. The shapefiles such as state boundaries that are included with HydroDesktop are located in its installation folder, e.g., C:\Program Files\CUAHSI HIS\HydroDesktop\.
The HydroDesktop project file also connects your work to a database (.sqlite file) where temporal data are stored. This is where the time series data that you download through HydroDesktop is saved. A relational database is much more efficient at storing time series data than shapefiles, and HydroDesktop uses a free database called SQLite for this purpose.
You can create projects to organize your work, and you can save the project so that you can open it up again later. When you first open HydroDesktop, it sets up a clean map and loads the default system database which is located in the HydroDesktop installation folder. In order to better manage the work in this exercise, you will create a new project and database.
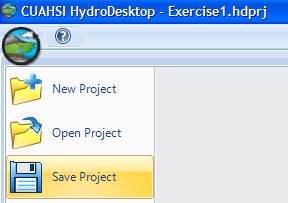
To create a new project and database:
1. Click the HydroDesktop Orb button.
2. In the Orb menu, click New Project.

Figure 5 Creating a New Project
3. Choose a location to save your project such as your desktop.
4. Name the project “Exercise1” and then click Save.
HydroDesktop will notify you that the project was created successfully. The text in the title bar of the HydroDesktop window should now include the name of your project. HydroDesktop has also created a database for your project named Exercise1.sqlilte. This database is saved in the saved in the same location as your project file.
![]()
You are now ready to work within your newly created project and database. To save your project after performing some work, click on the Save Project button in the Orb menu. To open a project, click on the Open Project button in the Orb menu.
IMPORTANT
In this exercise, it is best that you complete the procedure outlined in this document in one sitting and refrain from using the Open Project button, which is known to have bugs.
When searching for data in HydroDesktop, you can specify the following filters: region of interest, time period of interest, and variables of interest. HydroDesktop then search a catalog of known time series data to find locations of time series that match your search. You can either build and maintain this catalog locally using HydroDesktop, or you can rely on services provided by CUAHSI-HIS. In the latter case, for each query HydroDesktop actually asks a remote CUAHSI-HIS server for relevant entries from its national catalog (that’s what you’ll be using in this exercise, and it is also the default choice).
Search results showing locations of time series data that match your search are presented in the map. These results include information that HydroDesktop can use to connect to each individual data provider’s WaterOneFlow Web service for data access. You can further filter the results and then choose which data you want to actually download and store in your database.
When you save data to your database, it is stored as a theme. A theme is a collection of hydrologic time series data that have a common purpose. A theme can describe data from a geographic region (e.g., Texas, Colorado) to a hydrologic event (e.g., flood, hurricane) or a combination of both (e.g., Texas Flood). Simply put, a theme organizes a collection of related time series. HydroDesktop can save data to a new theme or append data to an existing theme. The workflow for finding data and saving it to a theme is shown below.
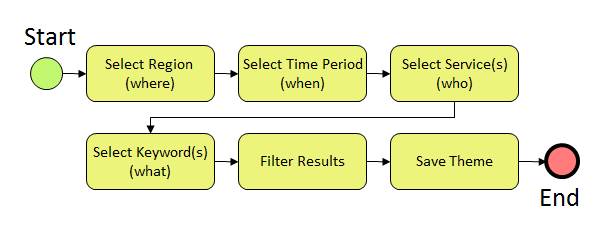
Figure 6 Workflow for Searching for Hydrologic Data
In this exercise, you will acquire streamflow data from the past year located within the San Marcos River Basin in Texas. As an instructional step, you will search for data in all of Texas to get a sense of what is available for the state and then filter the search results to find only those results within the San Marcos River Basin.
1. Click the Home tab in the ribbon to activate it.
2. In the Search Panel on the right, under the Area tab, choose U.S. States in the list of Active Layers. The map zooms to the extent of this layer while the Search Panel shows the fields in this layer.
3. Under Select Search Parameter, scroll through the state names until you find Texas. Click Texas to select it. The map zooms to Texas and highlights it in blue.
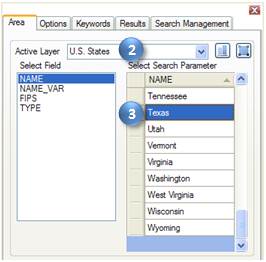
Figure 7 Choosing a Search Area
Next you will tell HydroDesktop the date range of time series that you want. You will also complete an optional step of restricting which data sources are acceptable. Restricting the search to one or two data sources improves search performance. The United States Geological Survey’s (USGS) National Water Information System (NWIS) is a great source for streamflow data. For this exercise, you’ll access their WaterOneFlow Web service which provides daily statistics of streamflow.
4. In the Search Panel, click the Options tab to activate it.
5. Specify the Start Date and End Date. For this exercise, search for data available in the last year (e.g., 9/1/2009 to 9/1/2010).
6. Place a check next to Show Web services Selection Panel. This shows the list of available data sources.
7. Click Select None.
8. Scroll through the Web services until you find NWIS Daily Values, and place a check next to it.
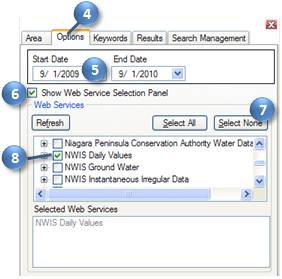
Figure 8 Setting the Date Range and Data Source to Search
Next you will tell HydroDesktop what hydrologic variable you want. To help you in this regard, HydroDesktop employs a list of official CUAHSI-HIS keywords for hydrologic variables. Data providers use this list when registering with CUAHSI-HIS. This is a lot easier than typing whatever term the data provider may have chosen on their own. For example, the USGS uses the term “00060” internally to describe streamflow!
9. In the Search Panel, click the Keywords tab to activate it.
10. Start typing “streamflow” in the Keywords text box. The list of keywords automatically selects keywords that match your search.
11. Click Streamflow in the list of keywords.
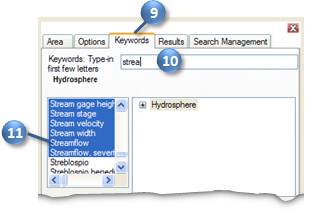
Figure 9 Choosing a Hydrologic Variable Keyword to Search
When you click Streamflow, the keyword list automatically jumps to the term “Discharge, stream.” It just so happens that “Discharge, stream” is the official keyword for what we think of as streamflow. However, the keyword list also includes synonyms like “streamflow” to make it easier to find the variable you’re after. To the right of the keyword list, you can see where stream discharge fits within the overall hierarchy of hydrologic variables.
Now that you’ve identified the right keyword, you’ll tell HydroDesktop execute the search using that keyword and the other parameters you already specified.
12.
In the Search
Panel, Click the Add button ![]() to add “Discharge, stream” into the
Selected Keywords box. You could add
more variables to search, but for this exercise let’s just search for
streamflow. Notice that all of your
search parameters are shown in the Search Summary at the bottom of the Search
Panel.
to add “Discharge, stream” into the
Selected Keywords box. You could add
more variables to search, but for this exercise let’s just search for
streamflow. Notice that all of your
search parameters are shown in the Search Summary at the bottom of the Search
Panel.
13. In the Search Panel, click Run Search.
HydroDesktop now asks the CUAHSI-HIS national catalog for descriptions of time series that match your search criteria. At this point, your software is using a remote online resource and bringing back data to display in your map. Isn’t that neat?
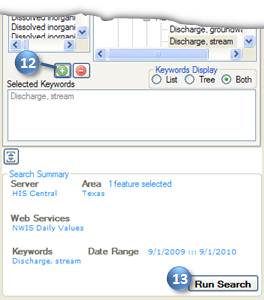
Figure 10 Executing a Search
After HydroDesktop has finished searching for time series, it displays the locations of time series that fit your search in a map layer called “Search Results.” These are stream gage sites reported by the USGS.

Figure 11
Search Results - Daily Streamflow Observations in
Texas
Now you can begin to refine these search results to locate time series that you actually want to download and save to your database. For this exercise, you’ll locate time series in the San Marcos River Basin.
To help you identify time series of streamflow in the San Marcos River
Basin, HydroDesktop includes data and tools to give you a spatial context for
the data. One of these is the ability to
display online basemaps from ESRI, Bing, and OpenStreetMap. These are beautiful cartographic maps cached
at multiple scales which are accessed in real time as you move around in the
HydroDesktop map. For this exercise, you will enable the ESRI Hydro Basemap.
This map shows rivers and watershed boundaries in the USA.
To enable the ESRI
Hydro Basemap:
1. On the Home tab in the ribbon, find the Online Basemap group. Click the drop down list of basemaps and choose ESRI Hydro Base Map.
2. Click Enable Basemap.
3. Select an opacity of 70 so that you can see some of the map layers under the basemap. Give it a minute or two to show up. Pretty neat map!!
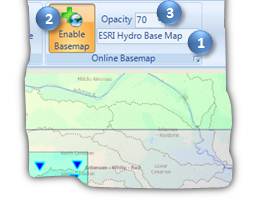
Figure 12 Enabling an Online Basemap

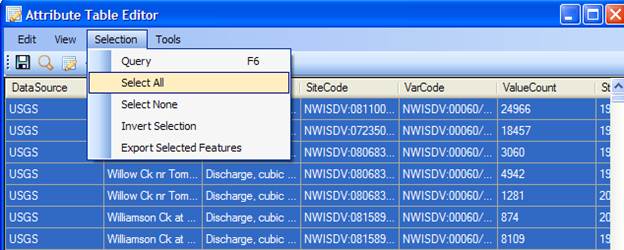
Pretty cool map!! If you right click on “Search Results” you can view the Attribute table of the search you just conducted
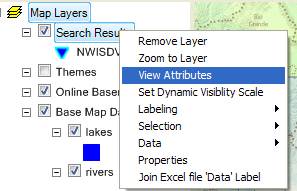
And if you use Select/Select All you’ll see all the rows in this table highlighted. Each row represents one Daily Streamflow Time Series recorded by the USGS in Texas. If you look in the bottom right hand corner of this display you’ll see how many such series there are in Texas.
To be turned
in: A picture showing the locations of
daily streamflow time series in Texas, and the value for the total number of
such series in Texas.
Use Selection/Select None as shown above to unselect all these sites.
Saving the
Search Parameters
If you go to the Search box and select the Search Management tab, you can give your search a name, such as Texas Streamflow, and hit the little save button to the right
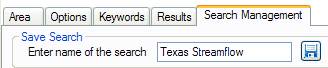
and you’ll see Texas Streamflow appear in the list of searches below, along with its search parameters, as shown below. This enables you to Restore the same search in the future without having to specify all the parameters again.
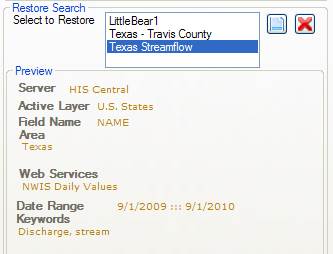
Save your project now so that you can restore all this later if you need to do so.
In addition to providing spatial context, you can see that this basemap will help you produce a more aesthetically pleasing printed map. But first, let’s find data in the San Marcos River Basin. You’ll use the Hydrologic Unit Code (HUC) watershed boundaries included with HydroDesktop to help with this.
Note
The Hydrologic Unit System is a standardized watershed classification
system developed by the USGS in the 1970s. Hydrologic units are watershed
boundaries organized in a nested hierarchy by size. The Hydrologic Unit Code
(HUC) is the 8 digit number or address used to classify watersheds in the
United States.
To find data in the
San Marcos River Basin:
1. In the Map Contents on the left, click to place a check next to the U.S. HUC layer to show this layer.
2. Right click on the U.S. HUC layer name and click on View Attributes.

Figure 13 Viewing the U.S. HUC Layer and Its Attributes
Information contained within the U.S. HUC layer will now be displayed in a table called the Attribute Table Editor. The Attribute Table Editor gives you the HUC code and catchment name along with some other information. You’ll use this table to find the San Marcos River Basin.
3. In the Attribute Table Editor, click on CATNAME to sort these catchment names in alphabetical order.
4. Scroll through the CATNAMEs until you find San Marcos and click on the row to select it.
5. Click on the Zoom to Selected icon at the top of the Attribute Table Editor to zoom the map into the San Marcos River Basin. The San Marcos River Basin will now be highlighted in blue on the map.
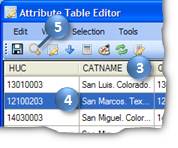
Figure 14 Selecting the San Marcos River Basin
6. Close the Attribute Table Editor.
You can now see some detailed hydrographic information about the San Marcos River Basin and its surrounding area along with your search results in the map. Next you will select the locations of time series within the basin.
To select
time series for download:
1. On the Home tab of the ribbon, in the Map Tools group, click the Select tool to activate it.
2. In the Map Contents, click the Search Results layer name to make that layer active. You can only select features on the layer that is active.
3. Using the left mouse button, draw a box around the sites in the San Marcos River Basin. The sites are highlighted in yellow as you select them. If you hold down the Shift key while drawing a second box, it will add the sites in that box to your existing selection. Continue until all sites in the basin are selected.
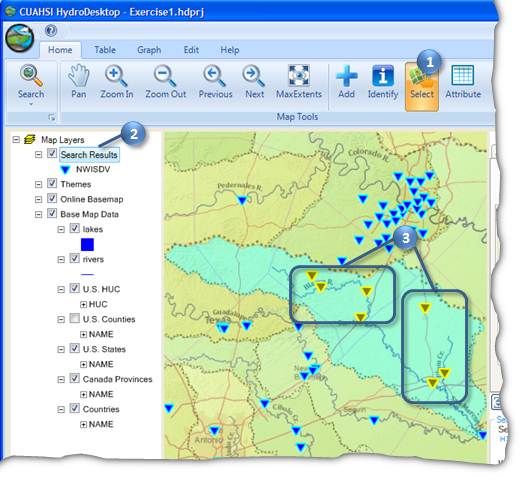
Figure 15 Selecting Sites in the San Marcos River Basin
4. In the Map Contents, right click the Search Results layer name and click View Attributes.
5.
In the Attribute
Table Editor, click the Show Selected button ![]() to show only those sites you selected in
the map.
to show only those sites you selected in
the map.
Take a moment to review the information in the Attribute Table Editor. The Search Tool in HydroDesktop returns a fair amount of metadata about each site that fits the parameters you specified during your search. You have information about the site name, variable name, number of values, overall period of record of data, etc. Note that the Start Date and End Date in the metadata displays the whole period of record for that site, NOT the dates that you specified in the search.
6.
Scroll to
the DataType field and Click on the
field heading to sort the time series by data type. The USGS reports statistics such as daily
average value and daily maximum value.
For this exercise, we’re only interested in the daily average values.
7.
Left click on all rows that have “Average” as
the DataType to select them.
Tip
Shift+Click and Ctrl+Click work in the Attribute Table Editor to help you select
multiple rows.
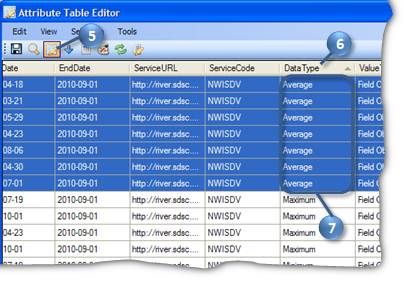
Figure 16 Selecting Time Series by Data Type
8.
Close the Attribute Table Editor.
With the right time series selected, now you’re ready to download data. Recall that when you save data, it is organized into a Theme and stored in the database associated with your HydroDesktop project.
To download
data:
1. In the Search Panel, in the Results tab, type “San Marcos Streamflow” in the New Theme text box.
2. Type “Daily average streamflow from USGS” in the Theme Description text box.
3. Click Download Data.
At this point, HydroDesktop connects to the WaterOneFlow Web services associated with each time series you selected in the map. In this case, there is only one service, the USGS NWIS Daily Values service. HydroDesktop retrieves the requested time series data from this service and stores the data in your new San Marcos Streamflow theme.
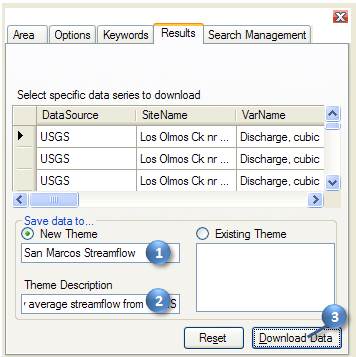
Figure 17 Saving a Theme
Once the download is complete, the new theme is shown under the Themes group in the Map Contents. If you create additional themes, they will also appear in the Themes group. At this point, you could view the attributes of this theme just like the other layers you’ve viewed in this exercise.
Now that you’ve downloaded the data, you can view the data in both tabular and graph form in HydroDesktop.
Visualizing Time Series Data
HydroDesktop takes a series-centric view of temporal data, meaning that
it provides access to the data at the time series level. An example of a time series is all of the
streamflow values measured at a certain point on the San Marcos River. Let’s take a look at a couple of time series
that you just downloaded.
To visualize time
series data in HydroDesktop:
1. Click the Table tab in the ribbon to activate it.
On the left you will see a list of all the time series in your database. You could use filters to restrict the time series that are shown, but you only retrieved a handful in this exercise so it’s fine to leave the default view.
2. Click to place a check next to any of the sites listed on the left (e.g., Blanco Rv at Wimberley, TX). The individual streamflow values along with their metadata are shown on the right.
Note
The table shows the local date and time of the data value as well as the
Coordinated Universal Time (UTC) date and time.
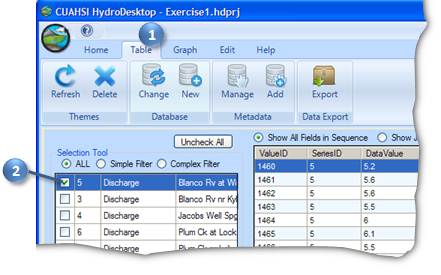
Figure 18 Tabular Representation of Time Series Data
Now let’s plot a graph of the data.
3. Click the Graph tab in the ribbon to activate it. A graph of the time series you selected in the Table tab is already visible.
IMPORTANT
Do not minimize HydroDesktop while the Graph tab is active! This is a known bug that causes errors in HydroDesktop.
4. Place a check next to another time series on the left. HydroDesktop allows you to visualize multiple time series on the same graph. The plot axes automatically adjust to fit your data.
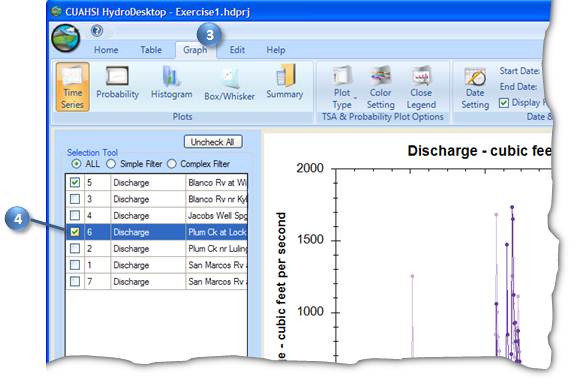
Figure 19 Graphical Representation of Time Series Data
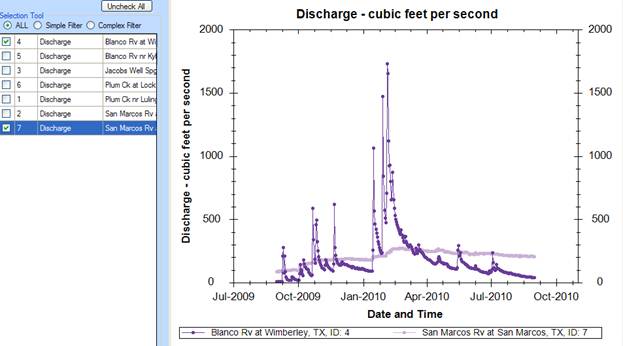
5. In the Graph tab of the ribbon, in the Plots group, select another type of graph. Take some time to familiarize yourself with the different plotting options in HydroDesktop.

Figure 20 Changing the Plot Type
The plots below show the discharge for the past year at the Blanco River at Wimberley and the San Marcos River at San Marcos. Notice how the Blanco river data shows the surface water response to precipitation events while the San Marcos River at San Marcos does not. Why is that so?
HydroDesktop can export data to a variety of different output file types for further study and analysis. Although HydroDesktop provides some analysis capabilities such the various types of plots, other programs may be necessary for certain types of analysis, which is why HydroDesktop includes the ability to export data. For this exercise, you will export data for an entire theme.
To export
time series data for a theme:
1. Click the Table tab in the ribbon to activate it.
2. In the Data Export group, click Export.
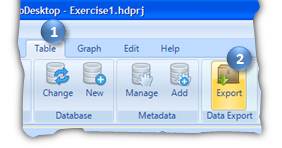
Figure 21 Exporting Data
This tool exports all data in a theme to a delimited text file. In the Export To Text File dialog, notice that your theme name is already selected by default. You can also control the fields that are included in the export and choose a delimiter. For this exercise, you will accept all defaults to produce a comma delimited text file.
3. In the Export To Text File dialog, specify the output file location and name.
4. Click Export Data.
5. Close the Export To Text File dialog when it is finished.
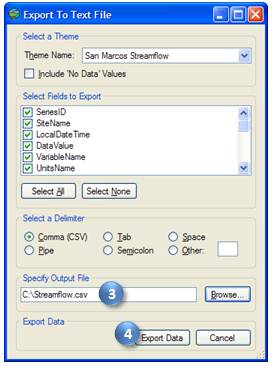
Figure 22 Setting Export Options
6. Find the file on your computer and open it to verify that the data were exported.
Now that you’ve investigated your data, you are ready to communicate your results. One way to do that is by printing and sharing a map. Before you share a map, you should make it presentation worthy. That beautiful basemap is a start. Let’s also add some labels showing the names of the stream gages in the San Marcos River Basin.
To label features in the map:
1. Click the Home tab in the ribbon to activate it.
2. In the Map Contents, turn off (uncheck) the Search Results layer so that only the San Marcos gages are showing.
3. Right click on the San Marcos Streamflow layer name and click Labeling | Label Setup.
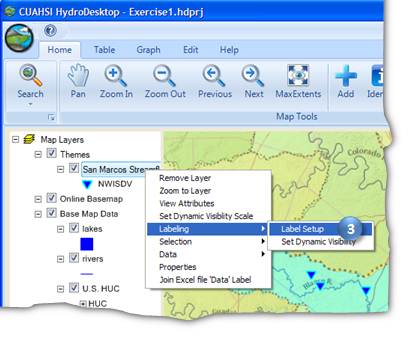
Figure 23 Accessing Label Setup
4. In the Feature Labeler dialog, in the list of Field Names, double click SiteName to use that field for the labels.
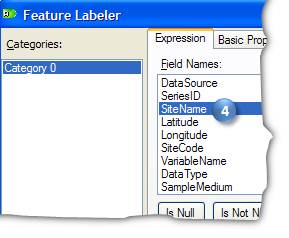
Figure 24 Choosing a Field for Labels
There are a lot of other label options available that you can explore once you’ve completed the exercise. For the exercise, the options below should result in decent labels.
5. In the Feature Labeler, click the Basic Properties tab to activate it.
6. Change the font size to 10.
7. Uncheck the Prevent Collisions box.
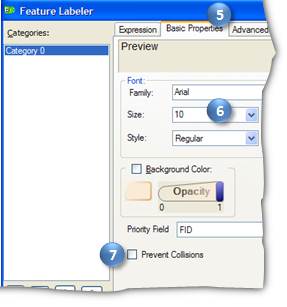
Figure 25 Setting Basic Label Properties
8. In the Feature Labeler, click the Advanced Properties tab to activate it.
9. Change Label Orientation to Middle Left.
10. Change the Offset to -6 in the X-direction.
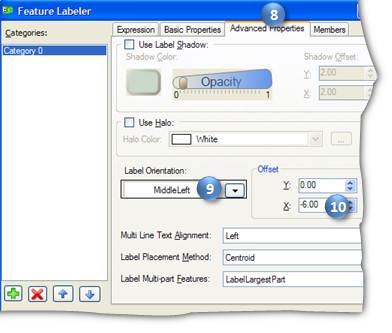
Figure 26 Setting Advanced Label Properties
11. Click OK. Your map should now be labeled according to the settings you have just chosen.
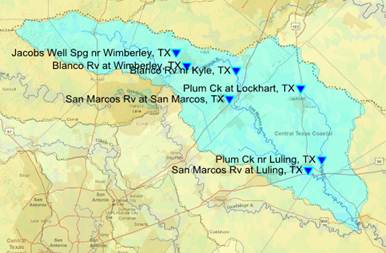
Figure 27 Stream Gages Labeled by Site Name
Now your map is ready to be added to a print layout!
Layouts and maps are an effective way of communicating a plethora of information efficiently. In this exercise you will create a layout that displays all the streamflow sites that you found within the San Marcos River Basin. You will also add a graph that corresponds to one of those sites. The final layout will look something like the one below.
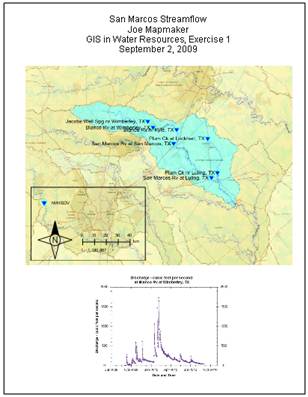
Figure 28 Example Print Layout
To create and print a
map layout:
1. Click the HydroDesktop Orb button.
2. In the Orb menu, click Print.
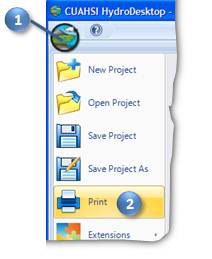
Figure 29 Accessing Print Options
This opens a DotSpatial Print Layout window where you can organize content for printing. You can zoom in and out of the layout by clicking the Zoom In and Zoom Out buttons at the top of the window.
3.
In the DotSpatial
Print Layout window, click the Insert
map button ![]() to activate that tool.
to activate that tool.
4. Using the left mouse button, draw a box on the layout to position your map.
The map fills the box that you drew. This is how all of the tools work that insert elements into the layout.
IMPORTANT
Do not add more than one type of element to the layout. For example, don’t add two text boxes or two
images. This is a known bug that may
cause HydroDesktop to freeze.
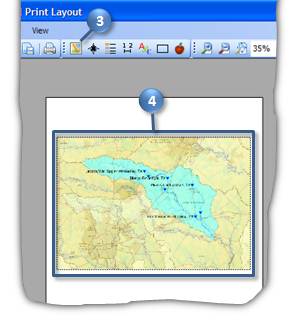
Figure 30 Adding a Map to the Layout
5.
Click the Insert
north arrow button ![]() to activate that tool.
to activate that tool.
6. Using the left mouse button, draw a box on the layout to position your north arrow.
Tip
You can click and drag to move elements or resize them once they have been added
to the layout.
7.
Click the Insert
legend button ![]() to activate that tool.
to activate that tool.
8. Using the left mouse button, draw a box on the layout to position your legend.
The legend currently includes all visible map layers. Let’s edit it to only show the streamflow theme.
9. With the new legend still selected, in the properties of the legend in the lower right corner of the window, click the word Layers to give that item focus.
10. Click the drop down arrow to the right of the word (Collection).
11. Uncheck all items except for Themes. You may have to click twice to uncheck item.
12. Click anywhere in the layout to confirm the changes. This is how you change properties of other layout elements as well.
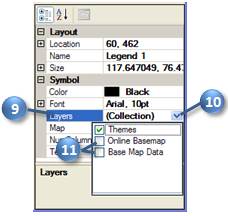
Figure 31 Setting Legend Properties
13.
Click the Insert
scale bar button ![]() to activate that tool.
to activate that tool.
14. Using the left mouse button, draw a box on the layout to position your scale bar.
15.
Click the Insert
text button ![]() to activate that tool.
to activate that tool.
16. Using the left mouse button, draw a box on the layout to position a title for the map.
17. Similarly to how you changed the properties of the legend, change the properties of the title text as follows:
a. ContentAlignment – TopCenter
b. Font – Set the size to 18
c. Text – Click the drop down arrow for this item to open the larger text box and then enter in four lines:
i. San Marcos Streamflow
ii. [your name]
iii. [class name and exercise, e.g., GIS in Water Resources, Exercise 1]
iv. [current date]
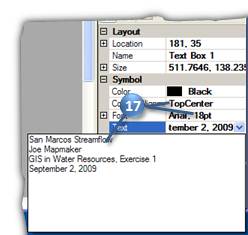
Figure 32 Setting Text Properties
18.
Click the Insert
rectangle button ![]() to activate that tool.
to activate that tool.
19. Using the left mouse button, draw a box on the layout around the scale bar, north arrow, and legend to group them together aesthetically.
The layout is starting to look nice. Next, let’s add an image of a streamflow graph.
20. Minimize the layout window.
21. In the main HydroDesktop window, click the Graph tab in the ribbon to activate it.
22. Under Selection Tool, place a check next to the site with the streamflow time series that you want to plot.
23. Right click on the graph and click Save Image As.
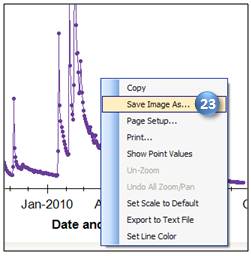
Figure 33 Plots can be exported to a number of image formats
24. Specify the location and name of the image to save. Choose Jpeg as the image type and click Save.
25. THIS STEP IS IMPORTANT!! Click on the Home tab and maximize the DotSpatial Print Layout window. (This prevents a potential crash due to a known bug.)
26.
Click the Insert
bitmap button ![]() to activate that tool. The tool prompts you for the location of the
image file that you want to insert.
to activate that tool. The tool prompts you for the location of the
image file that you want to insert.
27. Navigate to the image file that you just saved and open it.
28. Using the left mouse button, draw a box on the layout to position the graph image.
29. Save your layout by clicking File and then Save. Specify the name and location of your choosing.
With the layout prepared and saved, now you’re ready to print!
30. In the DotSpatial Print Layout window, click File l Choose printer to specify the printer to use.
31. Click File l Print to print your layout.
Congratulations! With printed map in hand, you’re ready to show others the characteristics of streamflow in the San Marcos River Basin that you were able to assemble from scratch. Nice job!
Remember to use resources at your disposal on the Help tab to communicate comments of issues you encountered as you completed the exercise. With your help, we can improve the way we find, download, and analyze hydrologic data!
Items
To Be Turned In
· A picture showing the locations of daily streamflow time series in Texas, and the value for the total number of such series in Texas.
· What is the peak streamflow for the Blanco River at Wimberley, TX, in February, 2010?
· Printed map layout with at least the following elements on it:
o Map of sites measuring streamflow in the San Marcos River Basin
o North arrow
o Legend
o Scale bar
o Title text with your name on it
o Graph of streamflow for at least one of the sites