Exercise 1 Solution
GIS in Water Resources
Fall 2010
Prepared by David R. Maidment
1. A picture showing the locations of daily streamflow time series in Texas is shown below. There are 903 such series in Texas with data available from September 2008 to September 2009.

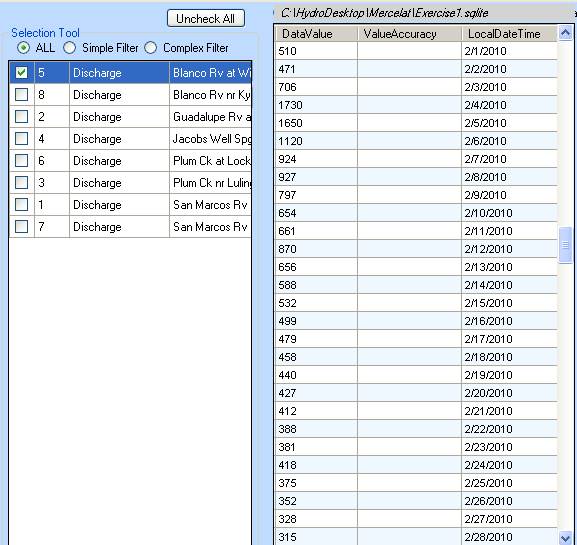
2. The daily streamflow values for the Blanco River at Wimberley, TX, in February, 2010 are shown below in the Table view in HydroDesktop. The maximum value is 1730cfs, which occurred on February 4, 2010.
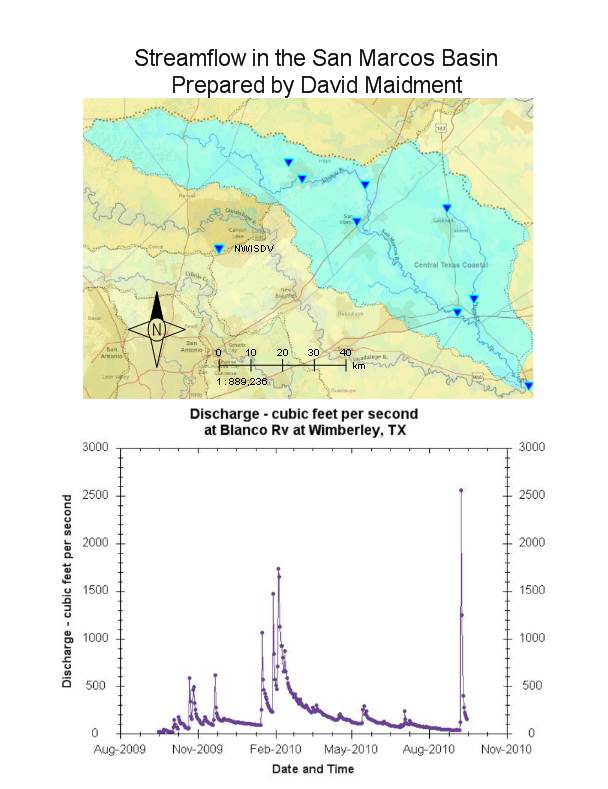
3. A map layout with the following elements on it is shown below:
a. Map of sites measuring streamflow in the San Marcos River Basin
b. North arrow
c. Legend
d. Scale bar
e. Title text with your name on it
f. Graph of streamflow for at least one of the sites