Getting
CE 394K.2
Hydrology
20 April 2007
Prepared by
Table of Contents
- Go to the MODIS web page
- Use the MODIS “Create Subsets” Tool
- Interpret the MODIS product
- Data download options
The
purpose of these notes is to provide a user guide to one method of acquiring
The Oak Ridge National Laboratory is the site of the NASA
DAAC for Biogeochemical Dynamics and focuses on processing NASA data products
for field ecologists. MODIS has several
sets of data products, for the atmosphere, oceans and land surface. ORNL serves the MODIS Land Products. A general description of this service is
available at: ORNLMODIS.pdf
The following procedure can be used to obtain them.
1. Go to the MODIS web page. This can be done by going to the general DAAC web site http://www.daac.ornl.gov/ and clicking on Get MODIS Land Product Data, as indicated below,

or by directly accessing the resulting web page at: http://www.daac.ornl.gov/MODIS/modis.html . The result appears as:
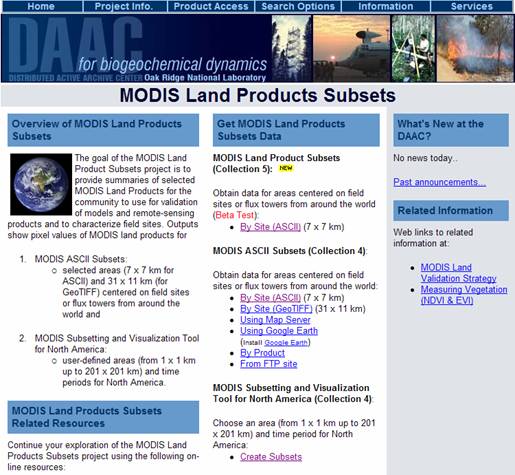
2. Use the MODIS “Create
Subsets” Tool
From
this display, http://www.daac.ornl.gov/MODIS/modis.html
select Create Subsets near the
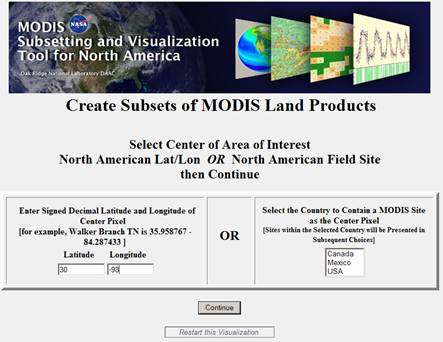
bottom of the page, which opens a Javascript application, as shown below. You can use either the left panel or the
right panel to indicate where you want your data to be drawn from, but not both panels. I have put in a data request centered on
30°North and 98°West. If you click on “
Once you’ve entered the center coordinates of your selected location, hit Continue.
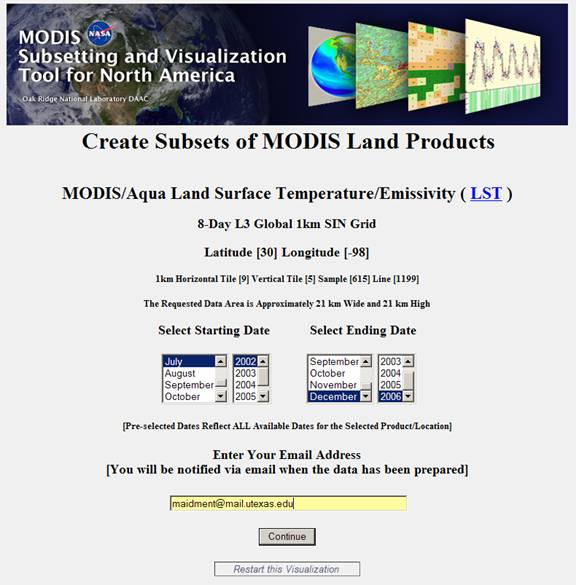
In the display that follows, I have selected Aqua Land Surface Temperature and Emissivity as the product I want, and a box of 10 km x 10 km as the spatial extent around the center location. The default box size is 3 km x 3 km and the maximum is 200 km x 200 km. MODIS products normally have a value for each 1 km x 1 km pixel and for each time interval.
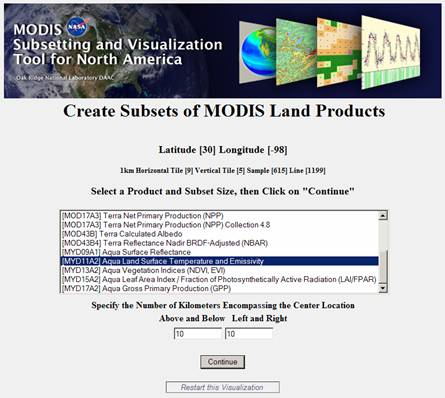
Aqua is one of the satellites from which MODIS data is obtained. In the following display, I have selected the default time period, from July 2002 to December 2006. The data are compiled at 8-16 day intervals in this period. A shorter time period will lead to a smaller download file and more rapid access. I have put my email address in the box indicated since this is how I will be notified when my product has been prepared.
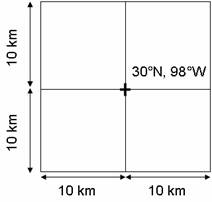
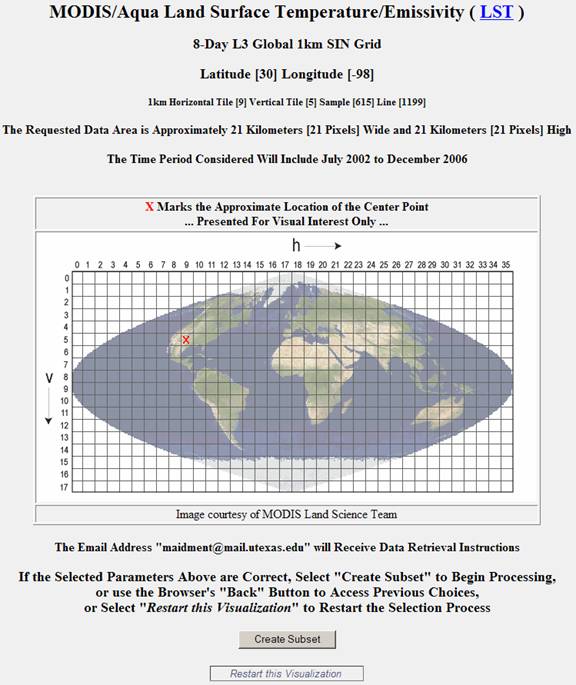
As shown in the diagram below, the effect of choosing 10 km is to select a box, centered on (30°N, 98°W), whose dimensions above and below that point, and to the left and right of that point, are all 10 km, or in other words of a total size of 20 km x 20 km.
And
the resulting display marks the point in the MODIS coordinate system that I
have selected, identifies my product and the spatial extent and temporal
duration of my request. MODIS data are
presented in a rather unusual Sinusoidal map projection, which is a cylindrical
map project with its central meridian in
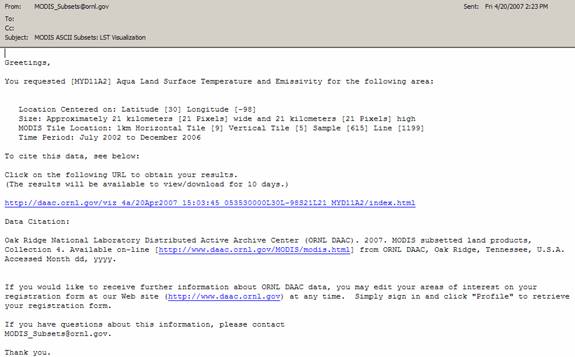
I hit Create Subset, and about 20 minutes later, received an email message to say that my product had been prepared.
![]()
3. Interpret the
MODIS Product
The email message reads as follows.
If you click on the http://daac... Link then a long html page opens whose header appears as:
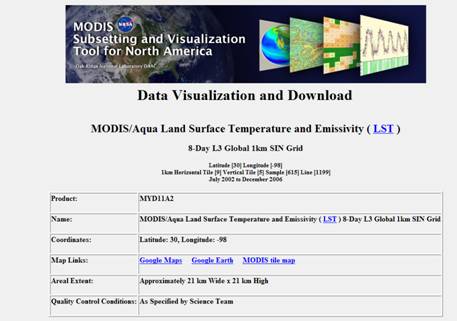
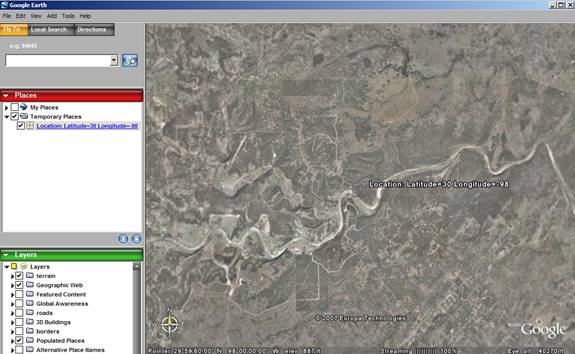
And if you click on Google Maps or Google Earth, you can see the location of your region of study in those displays:
Below the header in the html file are graphs of time series of values, in this case the Land Surface Temperature during the daytime in degrees Kelvin
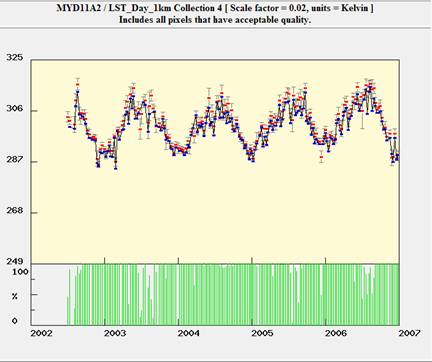
What this shows is that the daytime land surface temperature in central Texas varies from a low of about 287K (14°C or 57°F) during the winter time to about 310K (37°C or 99°F) during the summer time, which are reasonable numbers. The green bars under the graph show the percentage of the pixels queried that have acceptable values for each time point.
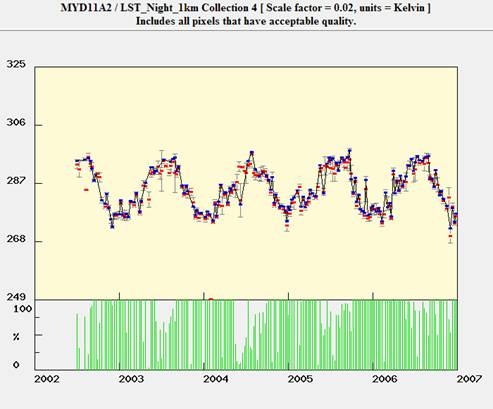
The similar graph for the night-time Land Surface Temperature is shown below, and it has lower temperatures, as you would expect. The term “Collection 4” refers to a set of methods of doing the conversion of remote sensing images to derived products. Collection 4 is the current collection for which all data are complete, but a transition is being made to a new set of method called Collection 5 that will eventually provide more refined estimates of the derived parameters.
Also included in the html output file is a land cover map in this area, with the individual pixel values shown for the cells I selected.
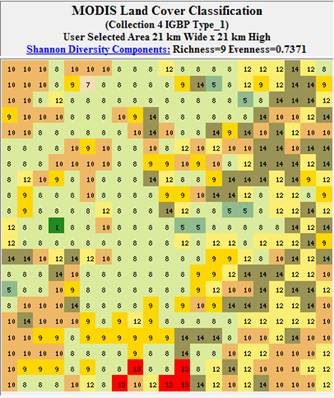
The numerical codes for these land cover values are:
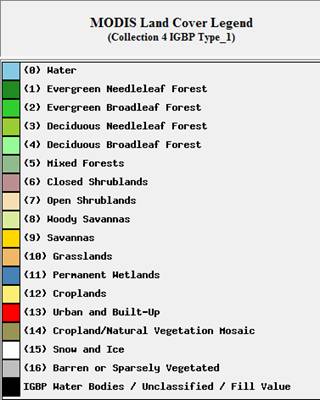
Which are drawn from a Global Land Cover Characteristics database classification system: http://edcsns17.cr.usgs.gov/glcc/
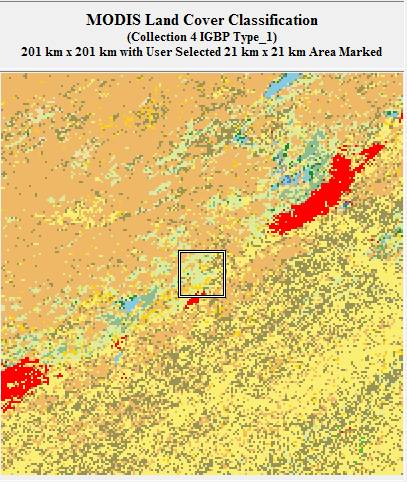
And
here is the land cover in the general region of the box I selected. The large red area to the upper right is
At the end of the html file there are a set of data download options that appear as:
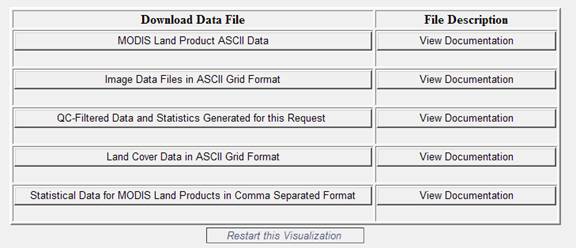
A set of instructions for importing the resulting files into ArcGIS 9.x, Envi, ArcView 3.x or GRASS is given at DataConversion.pdf
Good luck!