Data for each continent are presented in folders entitled Africa, Asia, Austral, Europe, Namerica, and Samerica, from which data from any region can be selected using Arcview selection tools. Another folder shows data for Texas which is used as a sample area for data display on a fairly small region since data display at continental scale can be quite time consuming when the data are viewed directly on the CD-ROM drive. Procedures for clipping out data for particular countries are presented in Exercise 1 in the Education Folder. The data describe precipitation, temperature, net radiation, soil water capacity, runoff and political boundaries for the earth. Each folder contains an Arcview 2.1 and 3.0 .apr project files that be used to display the data, which are suffixed 2 or 3, respectively, to refer to the version of Arcview that they apply to, e.g. africa2.apr displays data for Africa in Arcview version 2 and africa3.apr does the same for Arcview Version 3.0. If possible, view the data using Arcview version 3.0 project files because the cartography is better.
Table of Contents
The data coverages in the attribute tables are described as follows:
Precipitation: mean monthly values in mm (Pjan, Pfeb, Pmar, Papr, Pmay, Pjun,Paug, Psep, Poct, Pnov, Pdec) and mean annual value as Pann in mm.
Temperature: mean monthly values in degrees C (Tjan, Tfeb, Tmar, Tapr, Tmay, Tjun,Taug, Tsep, Toct, Tnov, Tdec) and mean annual value as Tann in degrees C.
Net Radiation: mean monthly values in W/m2. These values are attributed in the views as Jan, Feb, Mar, Apr, May, Jun, Jul, Aug, Sep, Oct, Nov, Dec and the mean annual value in W/m2 as Ann. In the attribute table, net radiation is denoted by Nr, and the various monthly values are denoted by Nr_jan, Nr_feb, ..., Nr_dec, and the mean annual value by Nr_ann. In order to provide for other kinds of net radiation estimates, the incoming solar radiation at the land surface is also attributed in the tables, as Swd (Short-wave downward), and the monthly and annual values are likewise denoted by Swd_jan, Swd_feb, ..., Swd_dec, and Swd_ann.
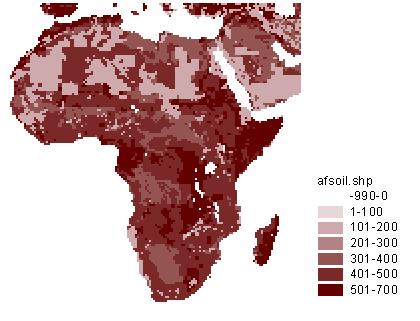
Soil Water Holding Capacity: value in mm as Whold
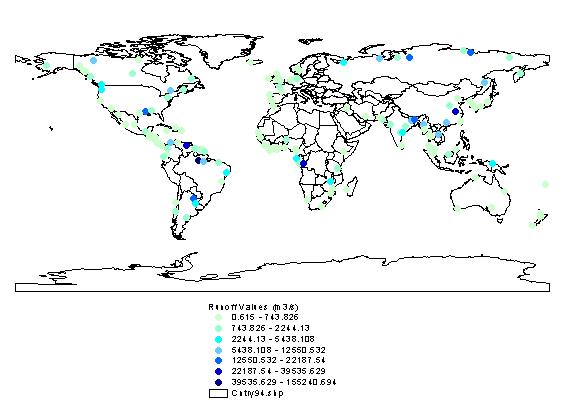
Runoff: the attribute file contains an identity number dischar_id which can be linked to the mean monthly and mean annual runoff values contained in a separate table called data.dbf which contains the same identity number for each station. The mean monthly and mean annual runoff values in m3/s along with the first and last years of record and the number of years of record.
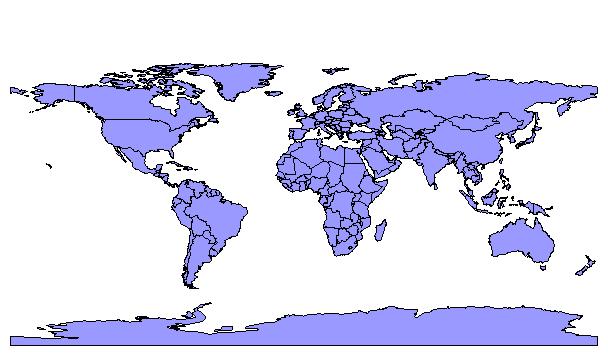
Political: the political boundaries of the countries of the world according to the FAO definition of boundaries. Attributes include the full and shortened versions of the name of the country.
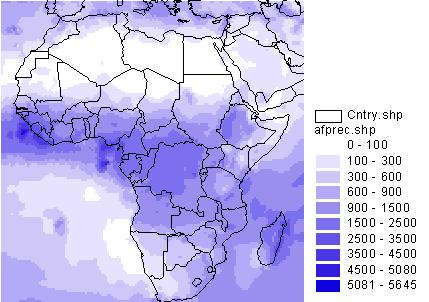
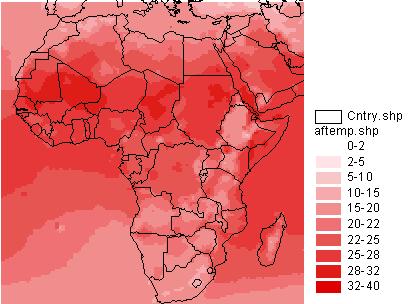
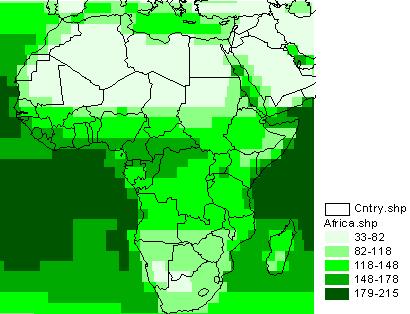
Examples of these data for Africa are shown below. Click on the precipitation, air temperature, radiation figures to see an animation of them.
Annual Precipitation (mm) (click on map to see monthly animation)
Mean Annual Air Temperature (oC) (click on map to see monthly animation)
Mean Annual Net Radiation ( W/m2) (click on map to see monthly animation)
Soil water holding capacity (mm): constant value
Runoff
The runoff folder contains a point coverage of the 160 global
stations. This includes monthly and annual average values in cubic meters
per second. Thesedata were obtained from the Global Runoff Center in Koblenz,
Germany, and were averaged by month for each station.
Political Boundaries
The political folder contains the theme Cnty, which displays
all political regions acoording to the FAO definition.