Atmospheric Water Balance Module
Center for Research in Water Resources, University of Texas at Austin
Introduction
Atmospheric water balance refers to the balance of the inflow and outflow of atmospheric moisture. By examining data on wind speed, temperature, and relative humidity, an atmospheric water balance calculates the flux of moisture through a region carried by the air mass passing through a control volume. The control volume is defined by the outline of the region, the land surface, and the top of the atmosphere. The atmospheric water balance is tied to an overall balance through the processes of evaporation and precipitation. A detailed discussion of the methodology of the atmospheric water balance is provided in Chapter 3 of the Spatial Water Balance of Texas report. A note of caution: the discussion in this chapter shows that in some cases the atmospheric water content data are not precise enough to make accurate estimates of the vertical water exchange of precipitation and evaporation over particular regions. The exercise presented in this section of the Atmospheric Water Balance of the Midwest Flood is fairly successful but a monthly atmospheric water balance of Texas that we did was less so. As the degree of detail and accuracy of atmospheric water content data improves, the usefulness of the atmospheric water balance method will increase.
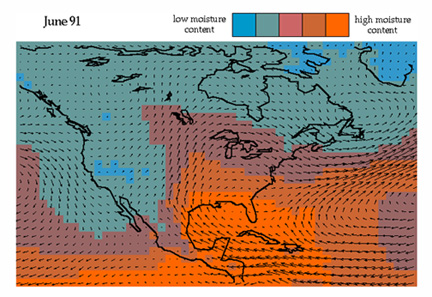
The flow of atmospheric water over North America during June of 1991 is shown below. The colors in this map represent the water content of the atmosphere, averaged over cells of 2 degrees of latitude and longitude, and over one month in time. This water content represents the average amount of precipitable water that an atmospheric column contains when integrated from the land surface to the top of the atmosphere. The arrows in the diagram depict the flow of atmospheric moisture, determined by taking the product of the wind velocity and the atmospheric water content, and integrating the result vertically through the atmospheric column. An animated moisture flow map can be viewed using the Quicktime or .avi viewers.
The data shown here were obtained from the US National Weather Service's National Meteorological Center (now called the Environmental Modeling Center of the National Centers for Environmental Prediction) which determines such values at regular intervals during each day as a part of its mission of numerical weather prediction to support weather forecasting. The data are determined by a General Circulation Model of the atmosphere whose equations are solved over the whole earth. Each 12 hours the condition of the atmosphere is sensed through radiosonde balloons released from weather stations, from satellite and from ground data sources, and the computed values in the GCM are adjusted to account for the measurements in a procedure called the Global Data Accumulation System. The computed values are archived at the National Center for Atmospheric Research in Boulder, Colorado, and the results shown here are time averages for monthly intervals of the archived data. A more refined mesoscale atmospheric model for North America, called the Eta model is presently under development at the Environmental Modeling Center's, Mesoscale Modeling Branch.
The true evolution of the atmosphere is best viewed in animation and 26 monthly images, from June 1991 to August 1993, can be seen using the Quicktime viewer or an .avi viewer using the attached files.
Because GCM's evolve over time in complexity and method, the computed values for comparable weather conditions in later years may not be quite the same as those in earlier years when the models were simpler than they are now. These differences have inspired reanalysis projects at the US Environmental Modeling Center in which the observed global weather data have been reassimilated for historical periods and the condition of the atmosphere recomputed with a consistent GCM. CD-ROMs of some data are available from NCAR. Comparable numerical weather prediction tasks and reanalysis projects have been carried out by the European Centre for Medium-Range Weather Forecasts located in Reading, England.
GH-Atmos is an atmospheric water balance tool developed by Jerome Patoux, Seann Reed, Ferdinand Hellweger, Zichuan Ye, Cindy How and David Maidment. It uses Avenue programs to generalize the border of a region, as well as to display the moisture flux and calculate the water balance.
The atmospheric water balance is done in two steps. An exercise and data are provided for each of these steps: processing the boundary (example data for the boundary of Texas) and computing the atmospheric water balance (for the 1993 Midwest flood).
Resources on this CD
Documentation/Exercises
Processing a boundary This exercise takes the polygon boundary of Texas, approximately 7000 km in length and originally consisting of about 25,000 line segments, and simplifies it into approximately 70 line segments of about 100 km each so that atmospheric moisture flow calculations can be done segment by segment in a reasonable way.
Exercise on the 1993 Midwest Flood This
exercise takes a similarly generalized border of the Upper Mississippi
Basin and part of the Missouri Basin and does an atmospheric water balance
using 12 hour time intervals from March to July 1993, during the great
flood which occurred in the Midwest at that time.
Programs
awatbal.apr
atmobal.apr
Data
Processing the Boundary: texas.shp, texas.shx, texas.dbf, latlong.gen
Exercise on the 1993 Midwest Flood: qvfile.txt, qufile.txt, sastline.shp,
sastline.shx, sastline.dbf, compflux.dbf
Resources on the Internet
Documentation/Exercises
Processing
a Boundary This is the same as on this CD-ROM
Exercise
on the 1993 Midwest Flood This is the same as on the CD-ROM
Surface Water Balance of the 1993 Midwest Flood This is a complementary exercise to the atmospheric water balance which examines the precipitation, evaporation, surface inflow and outflow, and changes in water storage on the flood region using daily time steps during the flood period.
Programs
awatbal.apr
atmobal.apr
Data
Processing the Boundary: texas.shp, texas.shx, texas.dbf, latlong.gen
Exercise on the 1993 Midwest Flood: qvfile.txt, qufile.txt, sastline.shp,
sastline.shx, sastline.dbf, compflux.dbf
Primary Contact
David Maidment
Center for Research in Water Resources
The University of Texas at Austin
email: maidment@crwr.utexas.edu

These materials may be used for study, research, and education, but please credit the authors and the Center for Research in Water Resources, The University of Texas at Austin. All commercial rights reserved. Copyright 1997 Center for Research in Water Resources.