The Corpus Christi Bay estuary system is currently being studied under the Corpus Christi Bay National Estuary Program (CCBNEP). As part of the program a research project entitled Estimation of Total Constituent Loadings to the Corpus Christi Bay System is conducted at The University of Texas at Austin. Besides estimating total constituent loadings to the bay system the project includes the calculation of a constituent mass balance in the bay system. For that calculation information about the hydraulics of the system is needed. It is the objective of the work described here to produce information about the hydraulics in the bay system.
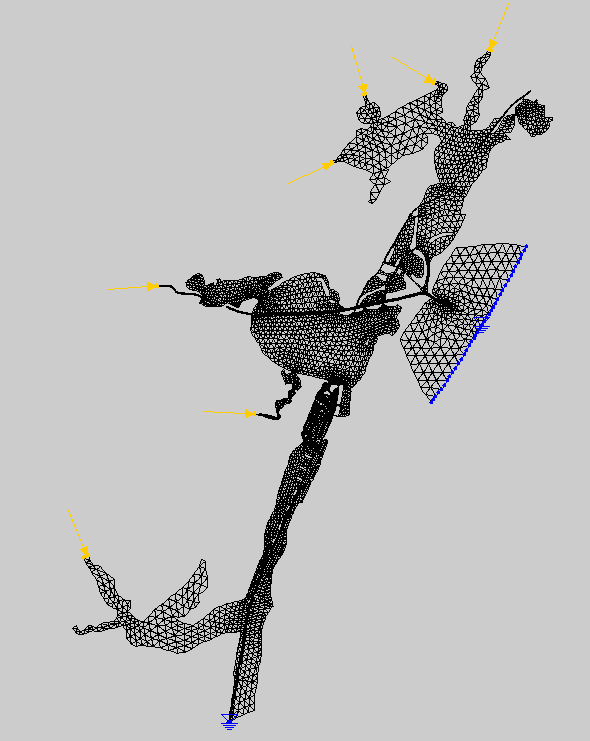
A steady state hydrodynamic model of the bay system was constructed. The model, which consists of over eight thousand triangular elements is constructed using TABS software distributed and maintained by the Waterways Experiment Station of the Army Corps of Engineers (Roig et. al., 1996). A graphical user interface called Surface Water Modeling System (SMS) ( Engineering Computer Graphics Laboratory , 1995) was used to pre- and post-process the data.
The model input was based exclusively on data compiled by Junji Matsumoto (1996a) at the Texas Water Development Board (TWDB). Matsumoto is currently developing a time variant model of the bay system. He uses TxBLEND, a modified version of the BLEND software developed by William Gray of Notre Dame University (Matsumoto, 1993). Construction of the TABS input therefore consisted of converting the time variant TxBLEND model input to steady state inputs.
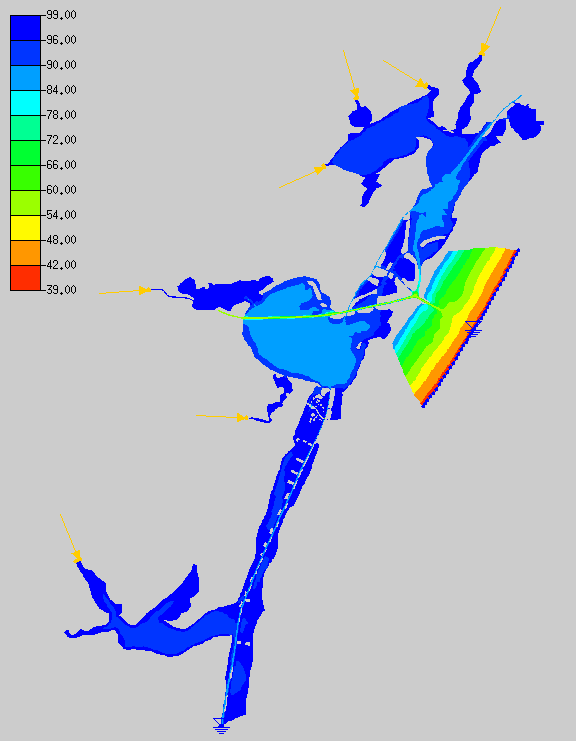
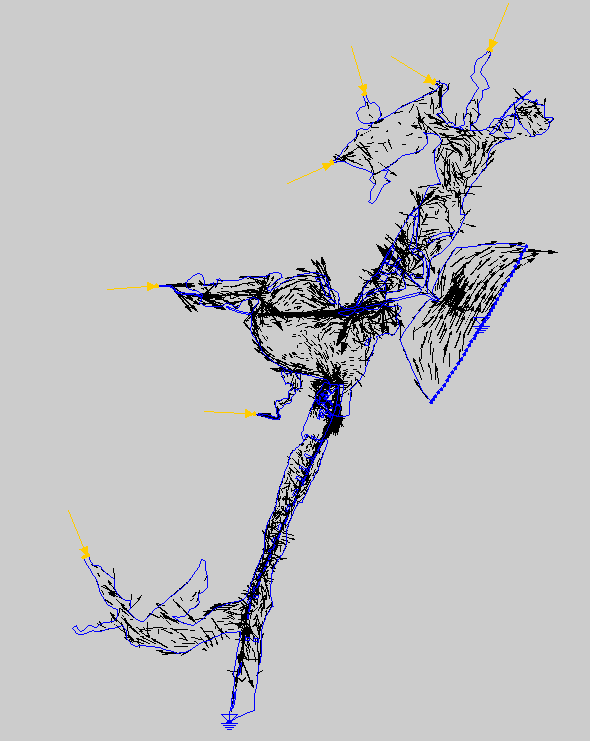
The model output consists of water surface elevation and velocity magnitude and direction. The water surface elevation is sloped due to wind friction. The wind set up in Corpus Christi Bay was checked against a simplified analytical solution and compares well. A mass balance calculation for the bay system verifies that the model is at steady state. The mass balance calculation also indicates a tendency to hypersaline conditions during low flow periods (droughts) which is consistent with reality. Simulated steady state velocity magnitudes under the JFK Causeway GIWW don't disagree with time variant velocity magnitudes observed and simulated by Matsumoto (1996b).
The model was constructed using TABS software. TABS is a collection of software programs for hydraulic computations. Specifically, the program RMA2 was used. Following is a brief description of RMA2 extracted from the RMA2 user’s guide. For more detailed information the reader is referred to TABS Online Documentation at the Waterways Experiment Station.
RMA2 is a two dimensional depth average finite element hydrodynamic numerical model. It computes water surface elevation and horizontal velocity components for subcritical, free-surface flow in two dimensional flow fields (Roig et. al., 1996).
RMA2 computes a finite element solution of the Reynolds form of the Navier-Stokes equations for turbulent flows. Friction is calculated with the Manning’s or Chezy equation, and eddy viscosity coefficients are used to define turbulence characteristics. Both steady and unsteady state (dynamic) problems can be analyzed (Roig et. al., 1996).
TABS input data is divided into two parts: a geometry file and a boundary conditions file.
As mentioned above, the input data was taken from the input data to the TxBLEND model. The construction of the TABS input data therefore consisted of deriving steady state inputs from the TxBLEND input data.
The time variant TxBLEND input data covers several different time periods. For example, the wind data was given from 1/1/70 to 8/31/95 whereas the Nueces River flow was given from 1/1/77 to 12/31/94. Data for most time variant parameters is available for the period 1/1/77-12/31/93. To be consistent time variant data from that period was used to derive the effective steady state inputs for most parameters.
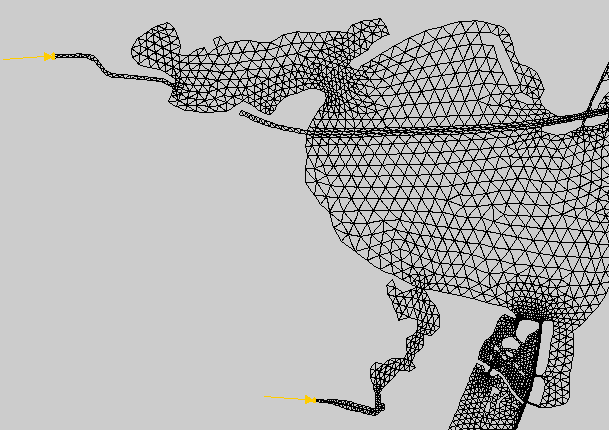
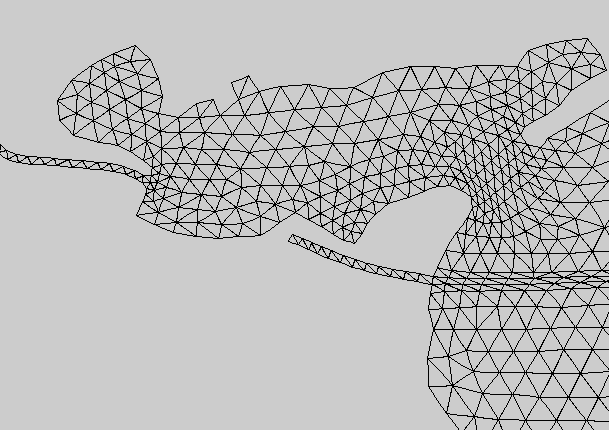
SegmentationThe TxBLEND model segmentation consists of 8,187 linear triangular elements with the nodal coordinates in meters. The nodal coordinates were converted to feet using Excel. To comply with the numerical constraints of TABS the nodal coordinate values had to be reduced. All x and y-coordinates were reduced by subtracting their respective minimum values which were 2,047,724.3 and 9,838,097.0 feet, respectively. That was done using Excel. The linear triangular elements were converted to quadratic triangular elements using SMS. Elements and nodes are specified in the geometry file with the GE and GNN cards, respectively.
Bottom Elevation
In the TxBLEND input data bottom elevations were given as depths. The TxBLEND input was converted to elevation values by subtracting the depths from a datum. An arbitrary datum was set at 100 feet below mean sea level. This was done to ensure only positive elevation values. The conversion was done in Excel. Bottom elevations are specified in the geometry file with the GNN card.
Material Properties
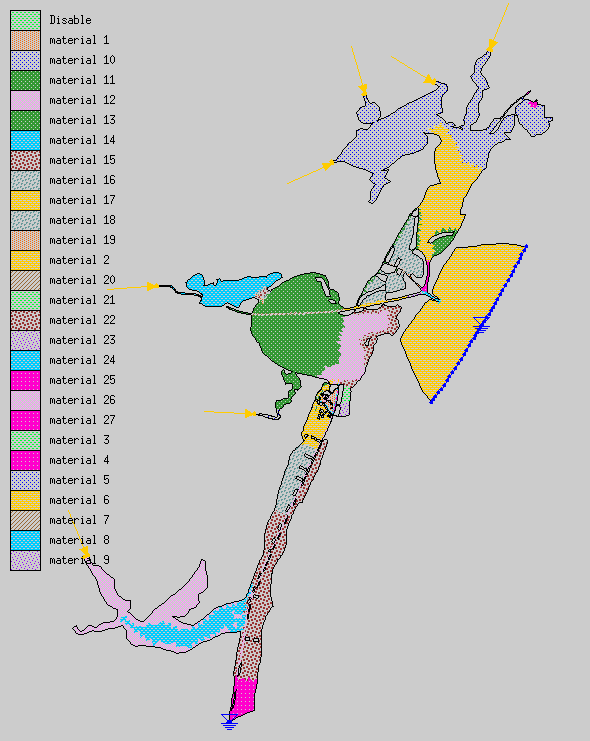
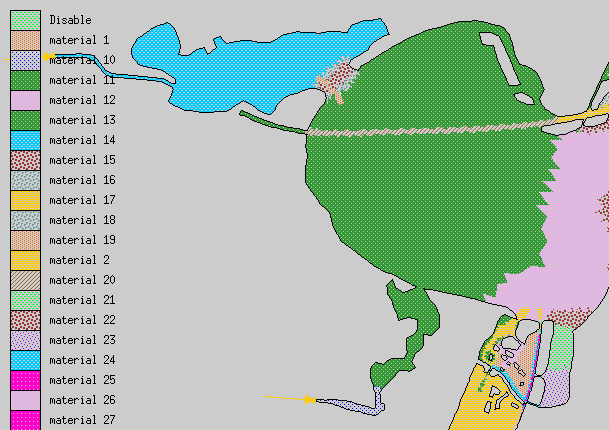
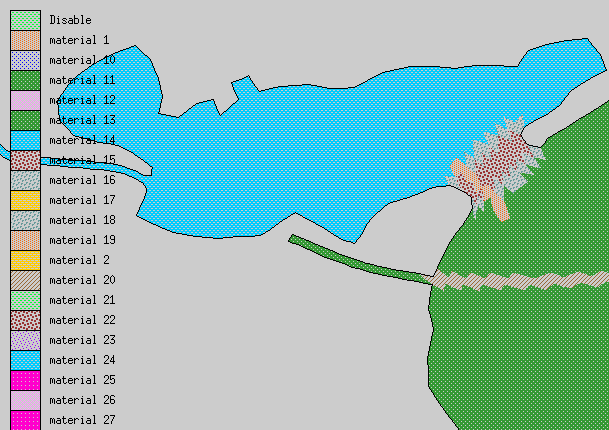
Material properties consist of Manning’s n values. The TxBLEND input data has Manning’s n values assigned to nodes. In TABS Manning’s n values are assigned to elements through material types. Each element was assigned a Manning’s n value equal to that of the majority of the three corner nodes. If all corner nodes had a different Manning’s n value the element was assigned a value equal to the first node. There is a maximum number of material types in TABS. For that reason the number of different Manning’s n values was reduced by rounding of one significant digit. This was done in Excel. Material properties are specified in the boundary conditions file with the EV card.
Material Manning's n Value Table.
Material Number     Manning’s n

1                   0.018
2                   0.019
3                   0.022
4                   0.023
5                   0.024
6                   0.025
7                   0.026
8                   0.027
9                   0.028
10                  0.029
11                  0.030
12                  0.031
13                  0.032
14                  0.033
15                  0.040
16                  0.045
17                  0.048
18                  0.050
19                  0.052
20                  0.060
21                  0.071
22                  0.090
23                  0.100
24                  0.110
25                  0.129
26                  0.201
27                  0.222
Downstream Boundary
The TxBLEND input data specifies tidal boundary conditions at the Gulf of Mexico and the Lower Laguna Madre as elevations. The arithmetic average of those elevations was calculated using Excel. The water surface elevation at the Gulf of Mexico and the Lower Laguna Madre was calculated to be 0.332 and 0.212 feet, respectively. The nodes making up a boundary are specified in the boundary conditions file with the GC card. Downstream boundary head for each boundary is specified in the boundary conditions file with the BHL cards.
InflowsThe TxBLEND input data contained average daily flows for the major inflow locations. All the inflows were obtained by averaging the TxBLEND inflows with Excel. The nodes making up a boundary are specified in the boundary conditions file with the GC card. Inflow data for each boundary is specified in the boundary conditions file with the BQL cards
Upstream Boundary Conditions Table.Evaporation and Precipitation
Inflow Boundary Flow [cfs] Aransas River 285 Baffin Bay Total Inflow 49 Cavasso River 119 Copano River 67 Mission River 285 Nueces River 478 Oso River 96
The TxBLEND input data gives daily values of evaporation and precipitation in inches per day. Evaporation and precipitation are assumed spatially constant and one representative value is given for the whole region. The values were averaged using Excel. The average evaporation and precipitation is 0.17 in/day and 0.09 in/day, respectively. The net precipitation was calculated as the difference between precipitation and evaporation to be -0.08 in/day or -0.0033 in/hr. Net precipitation is specified in the boundary conditions file with the RA card.
WindThe TxBLEND input data consists of wind speed and direction. The wind speed and direction will be used by TABS to calculate a wind shear stress using the following formula:
where
The wind stress coefficient varies with wind speed as follows:
The wind shear stress is therefore a nonlinear function of the wind speed. Calculating the steady state wind speed and direction as an arithmetic average would be wrong.
The effective steady state wind direction and speed was calculated by computing the shear stress vector for each hour and then computing the resultant vector. The direction of the resultant vector gives the effective steady state wind direction. The magnitude of the vector is divided by the number of data points to give the effective steady state shear stress. Given the effective steady state shear stress the effective steady state wind speed is calculated using a trial-and-error approach to the relationships given above. This was done using a FORTRAN program. The effective steady state wind direction is calculated to be 130 degrees clockwise from North. The effective steady state wind speed is 9 mi/hour. Wind data is specified in the boundary conditions file with the BWC and BW cards.
CoriolisThe TxBLEND input data specifies the effective latitude for the basin at 29.6 degrees North. Instabilities were encountered when using this option of TABS. The instabilities were not resolved. Latitude is specified in the boundary conditions file with the LA card. Due to the instabilities the LA card is commented out with the CO card.
Run Control ParametersRun control parameters consist of things like printing options, time step, total run time and convergence criteria.
The TxBLEND model uses a time step of 10 minutes. For a steady state model the time step can be as large as stability allows without sacrificing accuracy. The time step was chosen to be 30 minutes. The total model run time was chosen to be 24 hours. A hotstart output file is produced at the end of every 24 hour run which can be used as hotstart input for the next run. This is a convenient way to break up model runs. Time step and run time parameters are specified in the boundary conditions file with the TZ card.
The model wass run for 42 days. After 42 days a mass balance calculation closes with an error of less than 5%. That is assumed to be sufficient, since the accuracy of the input data is no greater than 5% as well.
The output consists of a full print output and a binary solution file which is readable by SMS.
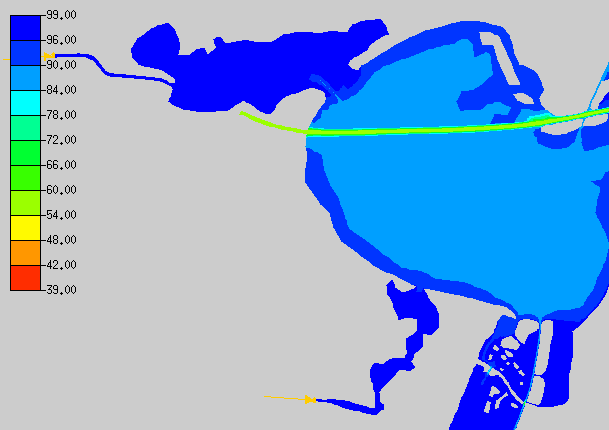
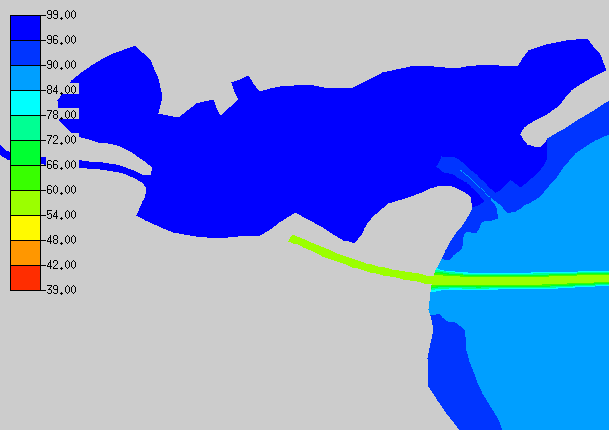
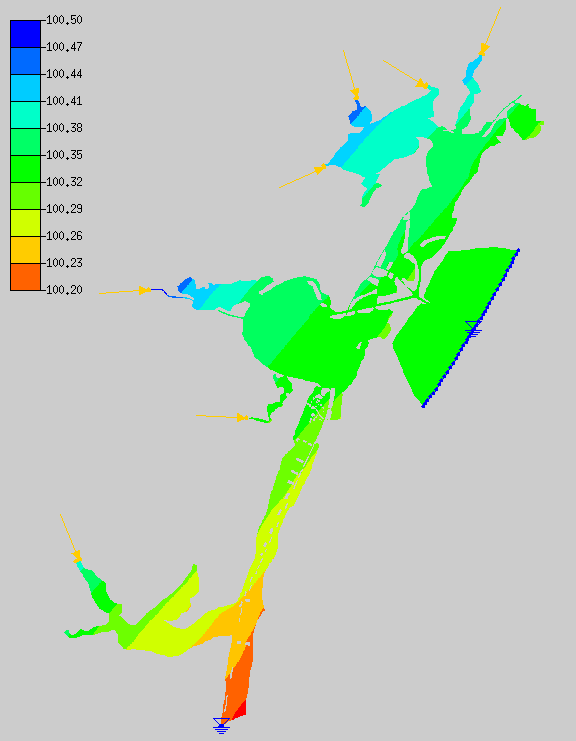
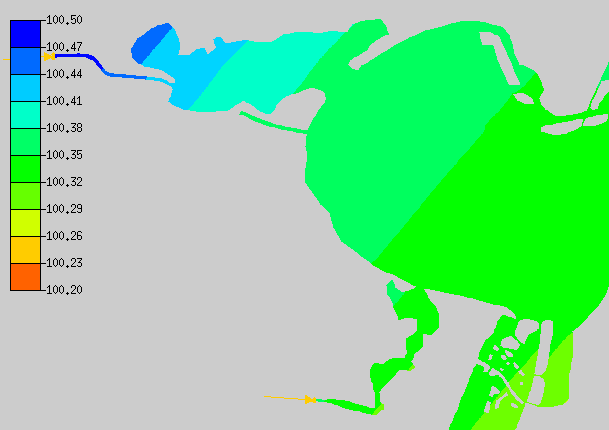
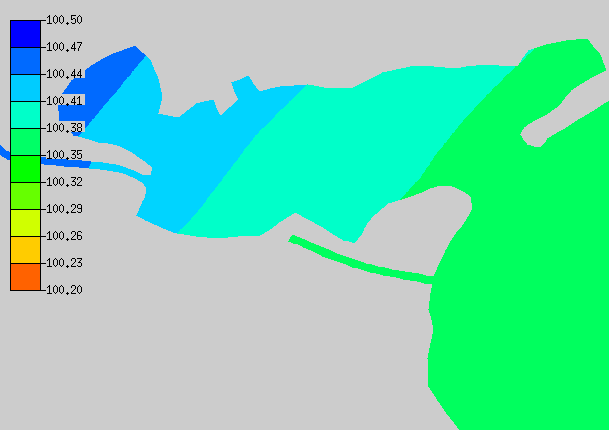
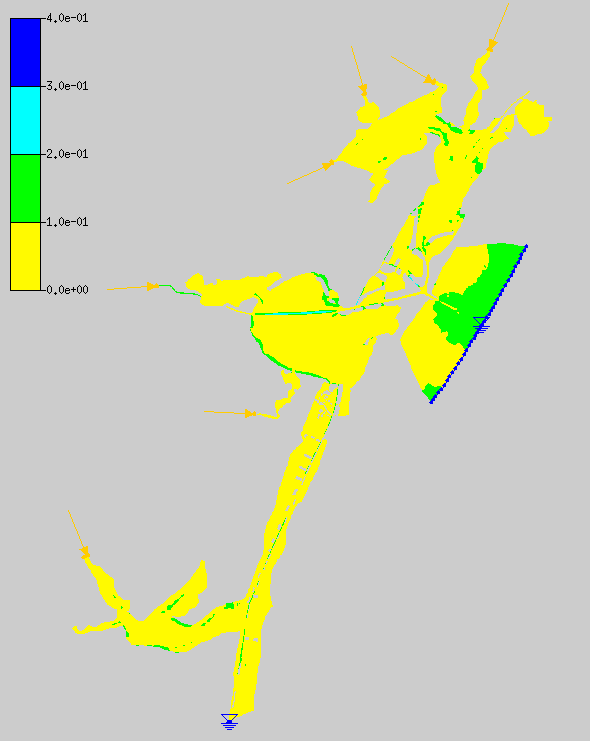
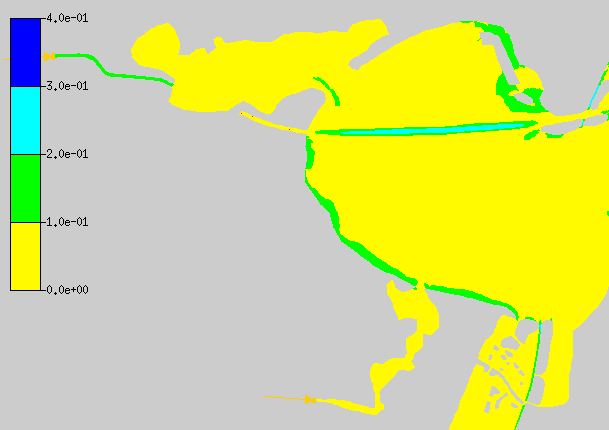
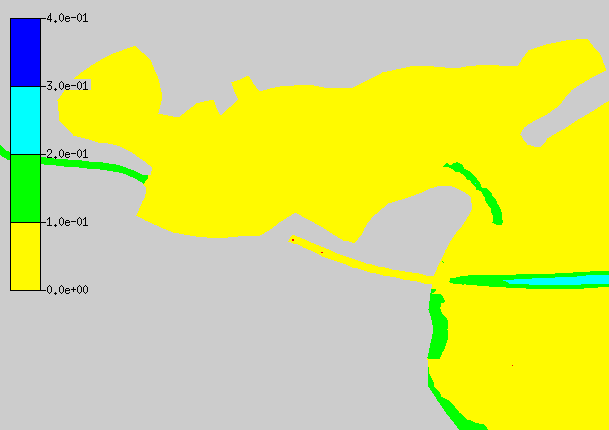
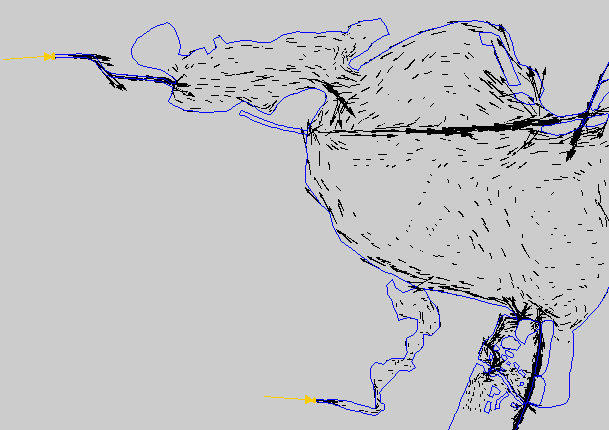
Water Surface Elevation
Water surface elevation (WSE) in the system is inclined with higher elevations inland. That inclination is due to the wind friction on the water surface. In Corpus Christi Bay, for example, the wind set up is 0.05 feet. If the case is simplified to a rectangular basin with uniform depth and no throughflow a solution can be found analytically. The wind set up for a rectangular basin 73,000 ft long and 12 ft deep subjected to the same wind is 0.04 ft. This compares well with the TABS solution.
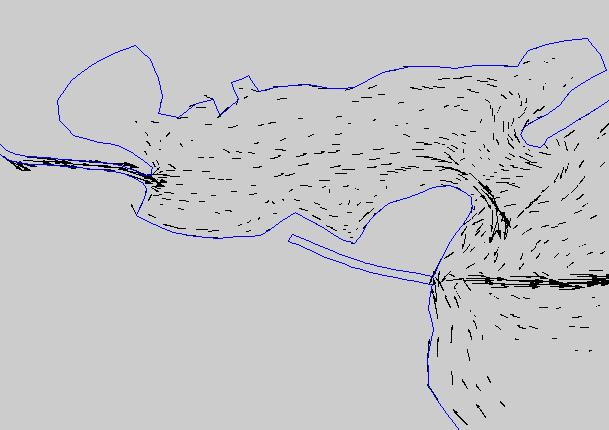
Velocity
TABS computes the flow rate across specified continuity check lines. The upstream boundary conditions as well as the opening to the Gulf of Mexico and the Lower Laguna Madre were used as check lines. At steady state the model input has to be the same as the model output.
Mass balance:
The mass balance closes to within 5% which is assumed to be acceptable. The results indicate that a major part of the inflow evaporates. If evaporation is assumed constant over longer time periods, a decrease in inflow (drought) would mean there would have to be a net inflow into the system. That would result in hypersaline conditions. The system is in fact hypersaline during drought conditions.
A comparison of the results was made with Matsumoto’s model (Matsumoto, 1996b). Since Matsumoto’s model is a time variant model and this model is a steady state model only order of magnitude comparisons can be made. The velocity magnitude underneath the JFK Causeway GIWW opening, for example, were compared. Matsumoto’s model results (as well as observations) indicate velocities on the order of magnitude of 1 fps oscillating with tidal cycles. The velocities are slightly more pronounced in one direction. This does not disagree with the maximum (steady state) velocity of 0.1 fps from the TABS solution.
The following conclusions can be drawn from the study.
Engineering Computer Graphics Laboratory, SMS: Surface Water Modeling System, Reference Manual, Version 4.0, Engineering Computer Graphics Laboratory, Brigham Young University, 1995.
Matsumoto, J., User’s Manual for the Texas water development Board’s Hydrodynamic and Salinity Model: TxBLEND - DRAFT February 1993, Environmental Section in the Planning Division, Texas Water Development Board, 1993.
Matsumoto, J., Personal Conversation, 10/21/96.
Matsumoto, J., Personal Conversation, 11/26/96.
Roig, L. C., Letter, J. V., McAnally, Jr., W. H., Thomas, W. H., Finnie, J., Users Guide to RMA2 Version 4.3, US Army Corps of Engineers, Waterways experiment Station, Hydraulics Laboratory, 1996.