Go to: Short Table of Contents, Long Table of Contents, HECPREPRO Page.
HEC-PREPRO is a GIS preprocessor for the Hydrologic Engineering Center’s (HEC) Hydrologic Modeling System (HEC-HMS). HMS is currently being developed by HEC as part of the NexGen program of research. The purpose of HEC-PREPRO is to summarize data from a GIS system so that they can be used as input to HEC-HMS. HEC-PREPRO takes stream, subbasin and elevation data layers as input data. The output data consists of an HEC-HMS Basin file and a ‘hydrologic’ and a symbolic data layer. The system is written in ArcView’s Avenue programming language.
The construction of a lumped parameter hydrologic model consists of two steps. First, a description of the watershed with a geographic data structure is constructed. This step consists of compilation and development of data needed to support the hydrologic calculations. Second, parts of the watershed are combined into hydrologic elements. Depending on the hydrologic element type and modeling method(s) to be used each hydrologic element is assigned corresponding hydrologic properties. This step also includes establishing connectivity of the hydrologic elements. In the hydrologic calculations the hydrologic elements are treated as black boxes that receive input and produce output which gets passed on as input to the next downstream hydrologic element. A more detailed description of the two steps is presented below.
1.1.1. Step 1. Construct a Description of Watershed with Geographic Data Structure.
The building of a lumped parameter hydrologic model begins with the construction of a description of the watershed with a geographic data structure. For several data a choice of existing data sets might exist or other data sets might be available to develop the data from. The subbasins, for example, can be defined several different ways:
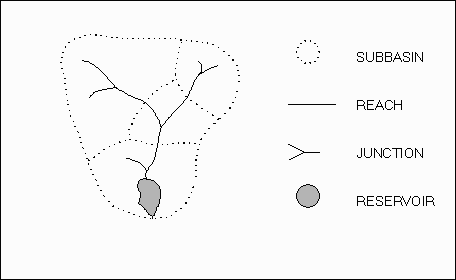
If these data are presented on a map or in a GIS the watershed is said to be described with a geographic data structure. Figure 1.1 illustrates such data description.
Figure 1.1. Sample Watershed Described with Geographic Data Structure.
Note that there are several data, like stream slope or observed hydrographs, which are not easily presented on a map. Those data can usually be connected to their corresponding geographic features as attributes. If that is done those data are also said to be described with a geographic data structure as well.
1.1.2. Step 2. Convert Watershed Data to Hydrologic Data Structure.
The second step in the procedure is to convert the watershed data to a form which is used as input to the modeling software. A lumped parameter hydrologic model operates on watershed data described with a hydrologic data structure. The hydrologic data structure consists of hydrologic elements including properties needed to support hydrologic modeling methods and the connectivity among those hydrologic elements.
First the hydrologic element type or class of each set of geographic features has to be established. This dictates the modeling methods available to convert the inflow to the outflow. A subbasin, for example, has a different set of modeling methods than a reach. Then the properties or attributes needed to support the modeling method have to be connected to the hydrologic element. Depending on the modeling method a different set of properties is needed. Routing a flow through a river might, for example, require the Manning’s n value whereas to determine the flow of water from a subbasin the surface area is an important property. Once the hydrologic elements have been defined connectivity of the hydrologic elements has to be established. This dictates the sequence of calculations in the hydrologic model.
Once the hydrologic elements have been defined and their connectivity is established the watershed data is said to be described with a hydrologic data structure. This data structure can be presented in a stick diagram form as shown in Figure 1.2 or in the form of an ASCII input file for a hydrologic model.
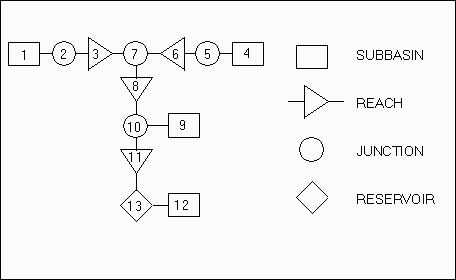
Figure 1.2. Sample Watershed Described with Hydrologic Data Structure.
This manual is written to serve as a user’s guide and reference manual. It provides documentation necessary to use the system including a detailed description of the methodology in Chapter 2, the input data in Chapter 3, a detailed description of the output data in Chapter 4 and information on how to use the system in Chapter 5. These chapters are designed to be read by the user before the system is used.
To modify the system, expand or reproduce it in another programming environment the procedure is discussed in detail in Chapter 6. The chapter is not designed to be read by the ‘everyday user’, bur rather to serve as a technical reference so that the system can be modified later if necessary.
Avenue programs are listed in Appendix A and sample output is presented in Appendix B.
Go to: Short Table of Contents, Long Table of Contents, HECPREPRO Page.
This chapter describes the general methodology for converting watershed data from a geographic to a hydrologic data structure. First the two data structures are defined followed by a step-by-step outline of the conversion procedure. The methodology is presented at a level of detail which is detailed enough for implementation into a GIS system, but not too detailed to limit the implementation to a specific GIS system. Detailed input data requirements and computational methods are presented in the following chapters.
2.2. Geographic Data Structure Definition.
This section defines the geographic data structure in general terms. A more detailed definition is provided in Chapter 3. The description of watershed data with a geographic data structure is not unique. In other words a watershed can be described with a geographic data structure in several different ways. Consider for example the description of streams. Several different ways of defining streams are presented below.
If the data are described in a way which is not desirable they can usually be converted using the GIS capabilities. For example: To convert the grid cell representation of a stream line to a single line representation the ARC/INFO GIS system offers the STREAMLINE function.
The geographic description of the watershed has to be free of hydrologic errors. A hydrologic error is different than a geographic error as described below.
In the geographic data structure used by HEC-PREPRO subbasins, streams, reservoirs and elevations are described as follows.
Thus, three data layers are needed for HEC-PREPRO: a line coverage of streams and reservoirs, a polygon coverage of subbasins, and a elevation grid to describe the land surface terrain.
2.3. Hydrologic Data Structure Definition.
This section defines the hydrologic data structure used by the HEC-PREPRO procedure. As with the geographic data structure the definition of a hydrologic data structure is not unique. Different lumped parameter hydrologic modeling software programs can use a different data structure. Consider for example subbasins and streams. In HEC-HMS they constitute two different hydrologic elements. In the TR-55 model the subbasins and their downstream reach(es) are combined into one element forming a balloon-like hydrologic element.
The data structure used in this study is identical to the one used by the HEC-HMS model and is defined by HEC (1996) as follows:
Subbasin. A subbasin is conceptually an element that produces a discharge hydrograph at its outlet. Its properties include area and percent imperviousness. The discharge hydrograph is based on subtracting "losses" from input precipitation, transforming the resulting precipitation excess to direct runoff at the outlet, and adding baseflow. If the modClark transform is used (with gridded rainfall), it is also necessary to access, by means of cell-parameter file, characteristics of subbasin grid cells.
River Reach. A river reach is conceptually a linear element for which there is a "known" discharge hydrograph at its upstream end, and which produces a discharge hydrograph at its downstream end. Data requirements vary from a single parameter for the simplest routing method to specification of a representative cross section and channel properties for more complex methods.
Junction. A junction is a location where two or more inflow hydrographs are added together to produce an outflow hydrograph.
Reservoir. A reservoir is similar to a routing reach in that there is a "known" discharge hydrograph that depicts inflow to the reservoir, and the reservoir element produces an outflow hydrograph. In the current version of HEC-HMS, capability only exists for routing through an uncontrolled reservoir, for which there is a monotonically increasing relationship between reservoir storage and outflow.
Diversion. A diversion is an element for which a portion of the inflow to the element is diverted out, and the remainder passes through. The diversion is based on a user-specified relationship between inflow and diverted flow. The diverted flow can be brought back into the basin network at a hydrologic element that is conceptually downstream from the point of diversion.
Source. A source is an element with which a discharge hydrograph is imported into the basin network. The element might be used to import an observed hydrograph, or a hydrograph generated in a prior simulation.
Sink. A sink is an element for which there is an inflow but no outflow.
The step-by-step procedure for converting watershed data from a geographic to a hydrologic data structure is presented in this section. The procedure is general and is independent of the GIS system used. Details of the procedure are presented in Chapter 6.
The procedure is presented using a sample data set. The data is a modified version of the Tenkiller Reservoir watershed located in North East Oklahoma and North West Arkansas. Some artificial features were added to the natural features of this watershed so that all seven hydrologic elements would be present in this example.
The procedure begins with a stream and a subbasin layer shown as solid and dotted lines, respectively, in Figure 2.1. The watershed is divided into four subbasins. One stream in the upper right subbasin was extended beyond the watershed boundary to simulate a source element. A lake, including an extra stream entering and leaving the lake, was added to the upper left subbasin. Finally, a diversion was added in the lower subbasin.
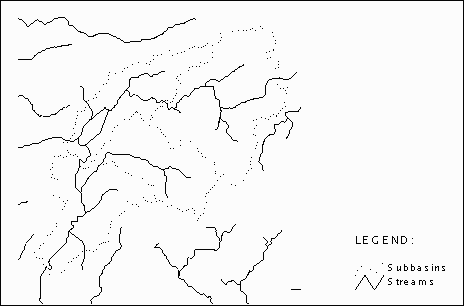
Figure 2.1. Input Stream and Subbasin Layers.
2.4.2. Intersect Stream and Subbasin Layers.
The stream layer is intersected with the subbasin layer to produce a new layer containing only those streams within the watershed as shown in Figure 2.2. This process removes streams outside the watershed and identifies the intersection of streams and subbasin boundaries. The intersections represent the locations of sources, subbasin outlets or sinks. The intersections are marked with solid triangles in Figure 2.2.
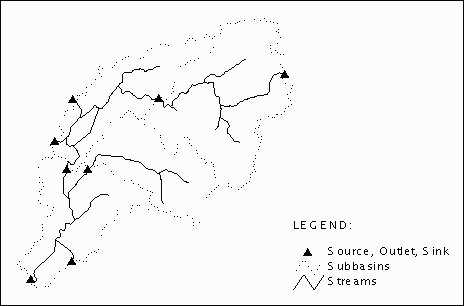
Figure 2.2. Result of Stream and Subbasin Layer Intersection.
2.4.3. Identify Channel System and Lakes.
Stream lines are classified into three types: (1) Lines that are part of the channel system carrying water from upstream features, (2) lines that are tributaries to this channel system, and (3) lines that are part of a reservoir defined by double-line connections between two channel nodes.
The lines forming the channel system are those downstream of hydrologic elements. There is always a source or a subbasin outlet at the most upstream end of a channel system, which means that the channel system can also be defined by being downstream of sources and subbasin outlets. The lines forming the channel system are identified by tracing downstream of the source, sink and subbasin outlet locations identified in the previous step.
A double-line connection between two locations on the stream defines an area or polygon which is commonly used to represent reservoirs whereas streams are usually represented with lines. Reservoir lines are identified by being part of enclosed polygons in the stream coverage.
The channel stream lines (heavy solid lines), the non-channel stream lines (light solid lines) and the reservoir outline (heavy dashed lines) are shown in Figure 2.3.
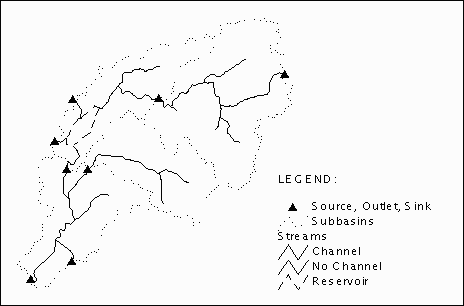
Figure 2.3. Results of Stream Line Classification.
2.4.4. Identify Channel Elements.
All the elements on the channel can be identified based on their relation to the connecting lines. For example: a node having multiple upstream lines is defined as a junction; a node having multiple downstream lines is defined as a diversion. Other functions a node can take on for a stream is being the most upstream or downstream part or being an interior (pseudo) node. The incorporation of lakes and reservoirs adds another five possibilities to set of functions a node can take on. A node located on a reservoir can be at the most upstream or downstream part of the reservoir, constitute an interior node or a junction or diversion out of the reservoir. There are a total of 10 functions a node can take on, as shown in Figure 2.4. This node-line topology provides a description of the hydrologic behavior of each node with respect to its immediate surroundings or on a micro-scale.
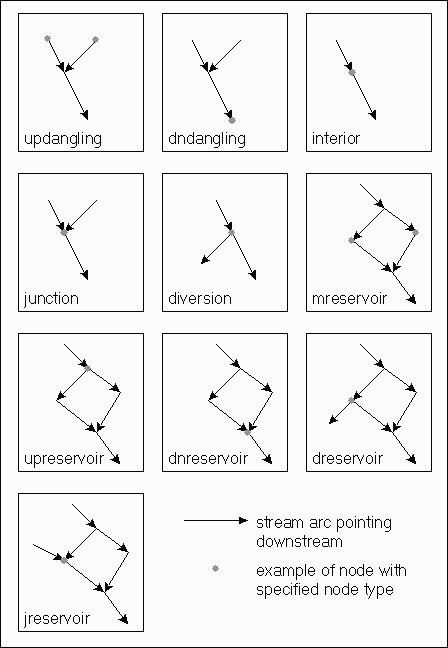
Figure 2.4. Node Type Illustration.
Note that this node-line topology can be calculated taking into account all the stream lines or only the lines belonging to the channel system. There are therefore two ‘types’ a node can take on. Consider, for example, the subbasin in the upper right corner of Figure 2.3. When taking all the lines into account there are four ‘junctions’ whereas when taking only lines from the channel system into account there are only ‘interior’ nodes. Also note that this assumes that streams defined by single and reservoirs bye double lines.
With this node-line topology the information can be further reduced to identify the functioning of each node in the overall flow network using the criteria shown in Table 2.1.
Node Type       Description

unknown         unknown
none            none
updangling      a node at the upstream end of a dangling line.
dndangling      a node at the downstream end of a dangling line.
interior        a node connecting two lines pointing in the same direction (a pseudo node).
junction        a node which has multiple lines pointing towards it and one line pointing away.
diversion       a node which has multiple lines pointing away from it and one line pointing towards it.
mreservoir      a node connecting two lines along a reservoir pointing in the same direction (a pseudo node).
mpreservoir     a node at the most upstream end of a reservoir
dnreservoir     a node at the downstream end of a reservoir.
dreservoir      a node at a reservoir diversion.
jreservoir      a node at a reservoir junction.
Diversions (hollow circles), junctions (solid circles), reservoirs (hollow triangles), sinks (upside-down solid triangles), sources (upside-down hollow triangles), and subbasin outlets (solid triangles) are shown in Figure 2.5.
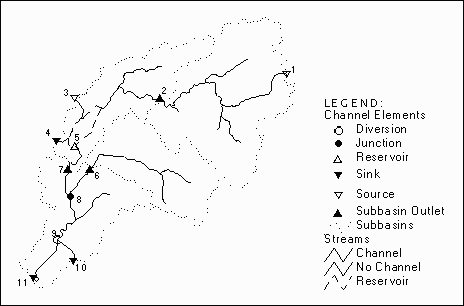
Figure 2.5. Results of Channel Element Identification.
2.4.5. Calculate Connectivity.
Subbasin elements are defined by the centroid of the polygons in the subbasin coverage. To establish connectivity among subbasin elements and subbasin outlets, the stream line upstream of the subbasin outlet is examined to identify in which polygon they are located. Subbasin elements are assigned a unique ID.
Connectivity among channel elements is established by moving along the channel streams from element to element. During this process multiple stream lines are combined into single reaches, that is, the lines that make up a particular reach are all assigned the same ID number. See Figure 2.6.
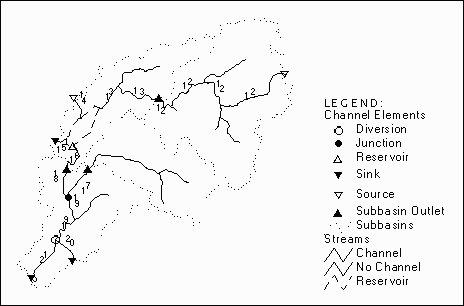
Figure 2.6. Results of Connectivity Calculation.
With all the channel elements established and connectivity identified, a symbolic layer is generated showing the schematic model of the flow network, as shown in Figure 2.7. The lines in the layer represent connections among hydrologic elements. A connection can be via a reach (heavy lines) or a link (light lines) from a subbasin to its outlet. The nodes in the coverage represent connections between channel elements. Channel elements can be diversions (hollow circles), junctions (solid circles), reservoirs (hollow triangles), sinks (upside-down solid triangles), sources (upside-down hollow triangles), and subbasins (rectangles). Note that elements previously classified as subbasin outlets are now combined with junctions, because in the hydrologic data structure they both serve as flow summing points.
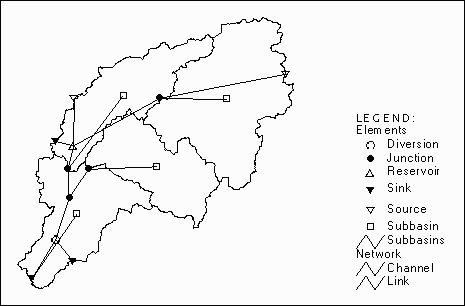
Figure 2.7. Symbolic Layer.
2.4.7. Create HEC-HMS Basin File.
The identification numbers of the hydrologic elements are written to the attribute tables of the input layers to allow for the relation back to the geographic data. The main purpose of the symbolic layer is for the user to check the results of the system. The schematic data model is written to a basin file readable by HEC-HMS. Figure 2.8 shows part of an HEC-HMS basin file.
Basin: HECPREPRO generated HMS basin file
     Description: HECPREPRO generated HMS basin file
     Last Modified Date: 10 June 1996
     Last Modified Time: 12:58
     Unit System: Unknown
End:

Subbasin:  23
     Canvas X:  115488.609
     Canvas Y:  1455012.500
     Downstream:  7
     Area:  845179044
End:

...

Source:  1
     Canvas X:  169282.81250
     Canvas Y:  1462399.39734
     Downstream:  12
End:

...

Reach:  12
     Downstream:  2
End:

...

Junction:  2
     Canvas X:  127482.82031
     Canvas Y:  1454141.12500
     Downstream:  13
End:

...

Reservoir:  5
     Canvas X:  99024.17188
     Canvas Y:  1438141.12500
     Downstream:  16 15
End:

...

Diversion:  9
     Canvas X:  93124.17188
     Canvas Y:  1406660.84829
     Downstream:  20 21
End:

...

Sink:  11
     Canvas X:  85182.82031
     Canvas Y:  1393441.12500
End:

...
Go to: Short Table of Contents, Long Table of Contents, HECPREPRO Page.
This chapter describes the input data requirements in detail. As input data a stream layer and a subbasin layer are needed. An elevation grid can be used to determine the location of the subbasin outlet for subbasins with multiple outlets. A stream location layer can be used to supply input attribute values for junction, diversion, reservoir, source and sink elements. The input data needs to be free of errors. The following sections describe the specific input data requirements for each of the four data sets.
3.3. Elevation Grid (optional).
3.4. Stream Location Layer (optional).
Go to: Short Table of Contents, Long Table of Contents, HECPREPRO Page.
This chapter describes the output data in detail. The output data consists of an HEC-HMS basin file, and a ‘hydrologic’ and a symbolic shape file.
4.1. HEC-HMS Basin File Output.
See Section 2.4.7 for a description of the HEC-HMS Basin File. As a minimum the HEC-HMS Basin file contains information to define the hydrologic elements, their location and connectivity among them. Table 4.1 lists the fields always contained in the HEC-HMS Basin file. The file also contains attributes as specified in the attribute transfer tables. See Section 5.4 for a description of the attribute transfer capabilities.
Hydrologic     Minimum Fields Valued in
Element Type   HEC-HMS Basin File.

Subbasin       Subbasin
               Canvas X
               Canvas Y
               Downstream
Reach          Reach
               Canvas X
               Canvas Y
               From Canvas X
               From Canvas Y
               Downstream
Junction       Junction
               Canvas X
               Canvas Y
               Downstream
Diversion      Diversion
               Canvas X
               Canvas Y
               Downstream
Reservoir      Reservoir
               Canvas X
               Canvas Y
               Downstream
Source         Source
               Canvas X
               Canvas Y
               Downstream
Sink           Sink
               Canvas X
               Canvas Y
4.2. Hydrologic Line Shape File Output.
A hydrologic (hydro) line shape file is created. The file is the result of the intersection of the stream line layer and the subbasin polygon layer. Several working fields are added to the attribute table. The attribute fields from the stream line layer are also in the hydro line attribute table. The attribute values from the stream lines are written to the corresponding attribute fields of the hydro lines. Table 4.2 lists the attribute fields.
Field Name   Description

hectype      hydrologic element type
hecid        ID
lhp          hydro point record number of reservoir outlet point
fphp         hydro point record number of point located at upstream end of stream
tphp         hydro point record number of point located at downstream end of stream
input        all fields from stream line layer
4.3. Hydrologic Point Shape File Output.
A hydrologic (hydro) point shape file is created. The file has points located at the intersection of lines of the hydro line shape file. In ARC/INFO terminology the points in the hydro point shape file are nodes of the lines in the hydro line shape file. Several working fields are added to the attribute table. Also, if a stream location theme was selected as input data the attribute values of any point in the stream location theme that lies within the tolerance of a point in the hydro point theme are written to the attribute fields of the point in the hydro point theme. See Section 5.4 for a detailed discussion of the attribute transfer methodology. Table 4.3 lists the attribute fields.
Field Name   Description

hecid        ID
hectype      hydrologic element type
rnt          node type taking into account all stream lines
hnt          node type taking into account channel system stream lines
rl           lines connecting
rupl         lines connecting upstream
rdnl         lines connecting downstream
rrl          lines from reservoir connecting
rrupl        lines from reservoir connecting upstream
rrdnl        lines from reservoir connecting downstream
hl           lines from channel system connecting
hupl         lines from channel system connecting upstream
hdnl         lines from channel system connecting downstream
hrl          lines from channel system and reservoir connecting
hrupl        lines from channel system and reservoir connecting upstream
hrdnl        lines from channel system and reservoir connecting downstream
input        all fields from stream location layer
4.4. Symbolic Line Shape File Output.
A symbolic (sym) line shape file is created. The lines represent reach elements or links. Several working items are added to the attribute table of the shape file. Also attribute fields as specified in the attribute transfer tables are added to the attribute table of the shape file. The attribute values from the corresponding stream lines in the hydro line shape file are transferred to the attribute fields of the lines in the sym line shape file. There are several options available for attribute transfer as described in Section 5.4. Table 4.4 lists the attribute fields.
Field Name   Description

hecid        ID
hectype      hydrologic element type
hecupid      ID of upstream element
hecdnid      ID of downstream element
hecupx       x coordinate of upstream element
hecupy       y coordinate of upstream element
hecdnx       x coordinate of downstream element
hecdny       y coordinate of downstream element
input        all items specified in the reach attribute transfer table
4.5. Symbolic Point Shape File Output.
A symbolic (sym) point shape file is created. The lines represent subbasin, junction, diversion, reservoir, source or sink elements. Several working items are added to the attribute table of the shape file. Also attribute fields as specified in the attribute transfer tables are added to the attribute table of the shape file. The attribute values from the corresponding subbasin polygon, if provided as input data, from the corresponding stream location point are transferred to the attribute fields of the points in the sym point shape file. See Section 5.4 for a detailed discussion of the attribute transfer methodology. Table 4.5 lists the attribute fields.
Field Name   Description

hecid        ID
hectype      hydrologic element type
hecupids     number of upstream elements
hecdnids     number of downstream elements
hecx         x coordinate
hecy         y coordinate
input        all fields specified in the subbasin, junction, diversion, reservoir, source and sink attribute transfer tables
Go to: Short Table of Contents, Long Table of Contents, HECPREPRO Page.
The system consist of Avenue programs that run inside ArcView. The Spatial Analyst is optional. The system consists of the following two Avenue programs:
The programs can be downloaded via anonymous ftp from:
Data       Value

Site       ftp.crwr.utexas.edu
Login      anonymous
Password   your e-mail address
Directory  /pub/crwr/gishydro/hecprepro/
Mode       ASCII
Files      hecprepr.ave
           heclegen.ave
           or
           prepro.apr
To install the system the scripts have to be loaded into script editors and compiled. The hecprepr.ave and heclegen.ave scripts have to be named ‘HECPREPRO’ and ‘HECLEGEND’, respectively. The scripts can be tied to buttons on the view button bar, to make their execution more user friendly. Alternatively the prepro.apr project can be downloaded and opened in ArcView directly. In the prepro.apr project the scripts are already compiled and tied to buttons on the view button bar.
The system is started by executing the HECPREPRO script either from the script editor or a button in the view button bar. When executing the script the input themes have to be active. This is done by clicking on the theme in the legend while holding down the ‘Shift’ key. The system will examine the input themes and identify which theme represents which feature. See chapter 3 for a detailed description of the input data requirements. Table 5.2 lists the input themes and identification criteria.
Input Theme      Required    Identification Criteria

Stream           yes         line feature theme
Subbasin         yes         polygon feature theme
Stream Location  no          point feature theme
Elevation Grid   no          grid theme
The system then prompts the user to supply the run control parameters. Run control parameters are listed in Table 5.3.
Variable Description                                 Default

attrib   Transfer attributes from the input data     no
         to the symbolic data layers and the
         HEC-HMS Basin file?
         (yes/no, see Section 5.4)

hmsmode  Where should the HEC-HMS Basin file be      hmsmode
         saved to?
         (default, path)

tol      Tolerance.                                  10
         (see Section 5.5)

oblevel  User Observation Level.                     2
         (see Section 5.6)
Attributes, like SCS curve number for subbasins or slopes for reaches can be transferred from the input data to the HEC-HMS Basin file. For that, each hydrologic element type has an attribute transfer table associated with it. Sample attribute transfer tables can be downloaded from the same location as the program files as described in Section 5.1 (see Table 5.5 for the names). The attribute transfer table specifies the name of the field in the input data, the name of the field in the output data and the transfer mode to be used. The attribute transfer modes are listed in Table 5.4.
Value   Description

0       No transfer
1       Transfer, reach attribute total
2       Transfer, reach attribute simple average
3       Transfer, reach attribute length weighted average
The tables are identified based on their names as listed in Table 5.5.
Hydrologic     Attribute Transfer
Element Type   Table Name

Subbasin       hecsub.dbf
Reach          hecreach.dbf
Junction       hecjunct.dbf
Diversion      hecdiv.dbf
Reservoir      hecres.dbf
Source         hecsourc.dbf
Sink           hecsink.dbf
The structure of the attribute transfer tables is identical. Each table has to be structured as shown in Table 5.6.
Field Name    Field Type   Field Length   Description

hmsfield      string       32             name of field in HEC-HMS Basin file.
Gisfield      string       32             name of field in input layer attribute table
transfer      number       1              transfer mode (see Table 5.4)
Attributes of the subbasin polygon in the input data can be transferred to the subbasin point in the sym point theme and the subbasin element in the HEC-HMS Basin File. The field name from the input theme is used in the sym point theme. The field name for the HEC-HMS Basin file is specified in the subbasin attribute transfer table. Table 5.7 lists an example subbasin attribute transfer table.
Hmsfield                Gisfield       Transfer

Label X                 x_coord        1
Label Y                 y_coord        1
Area                    area           1
LossRate                lossrate       1
Percent Impervious Area pia            1
Initial Loss            iniloss        1
Constant Loss Rate      conloss        1
Transform               trans          1
SnyderTp                snytp          1
SnyderCp                snycp          1
Baseflow                baseflow       1
Recession Factor        recfact        1
Flow / Area Ratio       fta            1
Flow to Peak Ratio      ftp            1
Attributes of the stream lines in the input data can be transferred to the reach line in the sym line theme and the reach element in the HMS Basin File. The field name from the input theme is used in the sym line theme. The field name for the HMS Basin file is specified in the reach attribute transfer table. Table 5.8 lists an example reach attribute transfer table and Figure 5.1 illustrates the methodology.
Hmsfield                Gisfield       Transfer

Description             desc           1
Label X                                0
Label Y                                0
Route                   route          1
Muskingum K             muskk          3
Muskingum X             muskx          3
Muskingum Step          muskst         1

Figure 5.1. Reach Attribute Transfer Methodology.
For attributes that are transferred with the length weighted average option the length of the stream lines is determined from the coordinate list of the line.
5.4.3. Junction, Diversion, Reservoir, Source and Sink Elements.
If a steam location theme was specified attributes of the point/node in the input data can be transferred to the element point in the sym point theme and the element in the HEC-HMS Basin File. The field name from the input theme is used in the sym point theme. The field name for the HEC-HMS Basin file is specified in the element attribute transfer table. Table 5.9 lists an example junction attribute transfer table.
Hmsfield                        Gisfield     Transfer

Label X                         x_coord      1
Label Y                         y_coord      1
Observed Hydrograph Pathname    obhpath      1
The tolerance specifies the spatial accuracy of the analysis. The tolerance is a distance in map units that should be set larger than the accuracy of the input data. Points that are distance less than the tolerance apart are considered to be connected. This is illustrated in Figure 5.2.
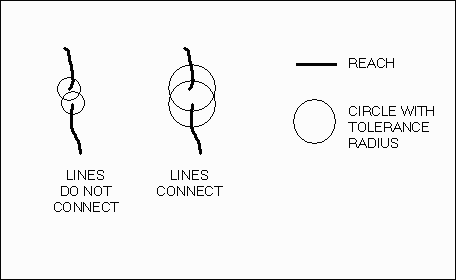
Figure 5.2. Tolerance Illustration.
Lines that are smaller than (half) the tolerance distance are also neglected from the analysis. This can serve as an alternative to the ‘node snapping’ option in the ARC/INFO implementation. Figure 5.3 illustrates this concept.
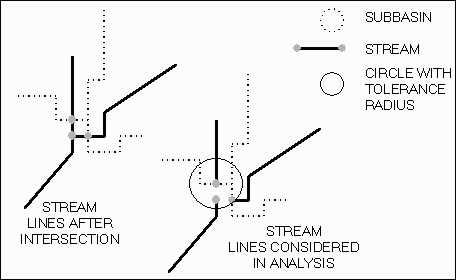
Figure 5.3. Using Tolerance as Node Snapping Alternative.
5.6. Specifying User Observation Level.
The user observation level controls the amount of information communicated to the user during program execution. The higher the user observation level the more information is displayed and the slower the program runs. Table 5.10 lists the user observation levels.
Value   Description

0       Not used.
1       Status bar is updated periodically.
2       Status bar is updated periodically and themes are added to the view and the display is redrawn at the end of each step.
3       Same as 2 except that the view is updated after each feature is added.
4       Debug mode.
The HEC-HMS Basin file is in ASCII format and can be viewed with any text editor or word processor.
5.7.2. Hydrologic and Symbolic Line and Point Shape File.
The hydrologic and symbolic line and point shape files are automatically added to the view containing the input data. The HECLEGEND program can be used to modify the legend of the themes. This program is also called from HECPREPRO at user observation levels of 2 or higher during program execution. Table 5.11 lists the colors assigned to each hydrologic element type.
Hydrologic         Color
Element Type

None               black
Subbasin           gray
Subbasin Outlet    cyan
Reach              green
Junction           dark green
Diversion          magenta
Reservoir          blue
Source             light green
Sink               red
Go to: Short Table of Contents, Long Table of Contents, HECPREPRO Page.
This chapter documents the procedure of the system in detail. For this discussion a type convention as shown in Table 6.1. is used.
Type        Convention              Example

Requests    class.request request   list.add request
Object      object (class)          hlftab (ftab)
Note that to increase readability most objects in the code are named with the class name as part of the name. The input line theme, for example, is named ‘iltheme’. Table 6.2 lists the data naming convention used for the different data sets.
Data Set        Key     Theme     Ftab       Shape      Shape
                                             Field      Object

input
Stream          il      iltheme   ilftab     ilshapef   ilshape
Subbasin        ip      iptheme   ipftab     ipshapef   ipshape
Stream Location in      intheme   inftab     inshapef   inshape
Elevation Grid  ig      igtheme   n/a        n/a        n/a
output
Hydro Line      hl      hltheme   hlftab     hlshapef   hlshape
Hydro Point     hp      hptheme   hpftab     hpshapef   hpshape
Sym Line        sl      sltheme   slftab     slshapef   slshape
Sym Point       sp      sptheme   spftab     spshapef   spshape
The processing is done in an Avenue program called prepro.ave. A legend utility is also available. The Avenue programs are listed in Appendix A. The section numbering system used in this discussion is consistent with that in the program code. For clarity several parts of the system procedure are omitted in this discussion. They are:
To keep the scope of the discussion manageable several repeated methods are also omitted in the discussion. They are:
The first step in the procedure is to do some general set up. This consists of such things as getting the input data and run control parameters, setting up the input data for further processing and reading the attribute transfer tables into memory.
The view (theview, view) is obtained by sending the application.getactivedoc request to the av (application) object. Note that this assumes that the view containing the input data is active when the script is run.
A list of active themes (theactivethemes, list) is obtained by sending the view.getactivethemes to theview (view). Note that this assumes that the input themes are active in the view. Then theactivethemes (list) is searched for the individual input themes. See chapter 3 for a detailed description of the input data. Table 6.3 lists the input themes and criteria for finding them.
Input Theme           Object Name   Found Variable   Criteria

Stream                iltheme       ilfound          line feature theme (ftheme)
Subbasin              iptheme       ipfound          polygon feature theme (ftheme)
StreamLocation*       intheme       infound          point feature theme (ftheme)
ElevationGrid*        igtheme       igfound          grid theme (gtheme)
6.1.3. Get Run Control Parameters.
The user is prompted to supply the run control parameters with the msgbox.multiinput request. Table 6.4 lists the run control parameters. See chapter 5 for a detailed description of each of the parameters.
Variable   Class     Assignment from Input               Default

attrib     boolean   if input.left(1).ucase = "N"        no
                     false else true
hmsmode    string    if input.left(3).ucase =            default
                      "DEF" ‘d’ else input
tol        number    any number in map units             10
oblevel    number    any number                          2
6.1.4. Set Up Hydrologic Element Type Dictionary.
The hydrologic element type dictionary (hedict, dictionary) lists the numbers and names of the hydrogic element types. This dictionary will be used in subsequent calculations. Table 6.5 lists the dictionary structure and Table 6.6 lists the values.
Position  Value                     Class

key       hydrologic element type   number
0         hydrologic element type   string
Key  Value

5    Subbasin
4    Reach
3    Junction
8    Diversion
10   Reservoir
7    Source
6    Sink
Setting up the input themes consists of getting the attribute table of each feature theme by sending it the ftheme.getftab request. The shape and attribute fields are obtained by sending the ftab.getfields request to each of the attribute tables. See Table 6.2 in beginning of this chapter for the object names.
6.1.6. Get Attribute Map Info.
This is only done if attributes are transferred as specified in the attrib (boolean) variable. The attribute transfer information is stored in the attribute transfer tables. Each hydrologic element type has its own attribute transfer table. See Section 5.4 for a detailed description of the attribute transfer methodology.
The attribute transfer or mapping information is read into attribute transfer dictionary (mapdict, dictionary). Table 6.7 lists the mapdict (dictionary) structure.
Position  Value                     Class

key       hydrologic element type   string
0         map attributes?           Boolean
1         table name                string
2         table vtab                vtab
3         field list                list
          (see Table 6.8 for structure)
Position  Value                                    Class

0         Name of field in HMS Basin file.         string
1         Name of field in input data              string
2         Transfer mode                            number
          (see Table 5.4 in
          Section 5.4 for values)
First a list of all the tables in the project (thetables, list) is obtained by checking the class of all the documents (thedocs, doc) in the project. This is done with the project.getdocs, doc.getclass and class.getclassname requests. Then the name of each table is checked against the list of names (Table 5.5, Section 5.4) using the object.getname request. Then each table is processed and mapdict (dictionary) is populated.
6.2. Create Hydro Line Shape File.
The stream line layer (iltheme) is intersected with the subbasin polygon layer (iptheme). Note that the procedure in this section is based on a script called ‘View.IntersectThemes’ written by ESRI. The script supports feature selection and projections. Support of feature selection means that if the input theme has several selected features the code will only operate on those features. Support of projections means that the code will operate on the features in the projection defined in the view. These properties of the code have been retained in this part of the system. The remainder of the system does however not support them.
6.2.1. Set Up Hydro Line Theme.
The result of the intersection is the hydro line theme (hltheme, ftheme). The file name for the hydro line theme (hlfilename, filename) is assigned with the project.makefilename request, which checks if the name allready exists and adds a number to the name if it does exist. If, for example, a shape file named ‘hydrol7.shp’ exists the project.makefilename creates a filename called ‘hydrol8.shp’. Note that this way data from previous runs will not be overwritten. The hydro line attribute table (hlftab, ftab) is created with the ftab.makenew request. Working fields are created using the field.make request and added to hlftab (ftab) using the ftab.addfields request. Table 6.9 lists the working fields.
Field Name    Field Type    Field Length/Precision   Description

hectype       number        16/4                     hydrologic element type
hecid         number        16/4                     ID
lhp           number        16/4                     record number (hpftab) of reservoir outlet point
fphp          number        16/4                     record number (hpftab) of point located at upstream end of stream
tphp          number        16/4                     record number (hpftab) of point located at downstream end of stream
If attributes are transfered (attrib, boolean) the fields of the input stream line attribute table (ilftab, ftab) are also added to hlftab (ftab). The ‘shape’ field (hlshapef, field) in the attribute table is obtained with the ftab.findfield request. Finally the hydro line attribute table (hlftab, ftab) is made editable using the ftab.seteditable request.
First the selected features in the stream and subbasin themes are assigned to working objects (theme1, theme2, fthemes). This done to support feature selection. The code only operates on selected features.
Each polygon in the temporary subbasin theme (theme2, ftheme) is processed. Note the syntax to support projections. All the lines in the temporary stream theme (theme1, ftheme) that are fully or partially within the polygon are selected using the ftab.selectbyshapes request.
Then each of the selected lines in the temporary stream theme (theme1, ftheme) is checked to see if it is fully contained inside the polygon using the shape.iscontainedin request. If the line is fully contained in the polygon it is added to the hydro line theme (hltheme, ftheme). If it is not fully contained in the polygon the part of the line that is inside the polygon is clipped of the line using the shape.lineintersection request and that line is then added to the hydro line theme (hltheme, ftheme). Adding a line is done by creating a new record with the ftab.addrecord request and writing the line shape to the ‘shape’ field using the ftab.setvalue request. The attribute values of the line in the stream line theme (iltheme, ftheme) are written to the attribute fields of the line in the hydro line theme (hltheme, ftheme).
6.3. Create Hydro Point Shape File.
The hydro point theme (hptheme, ftheme) is a point shape file with points at the intersection of lines in the hydro line theme (hltheme, ftheme). In other words the points in the hydro point theme (hptheme, ftheme) are nodes for the hydro line theme (hltheme, ftheme).
6.3.1. Set Up Hydro Point Theme.
Similar to the set up for the hydro line theme (hltheme, ftheme) this includes the specification of the file name, creation of ftab and addition of working fields. Working fields are listed in Table 6.10.
Field Name    Field Type    Field Length/Precision   Description

hecid         number        16/4                     ID
hectype       number        16/4                     hydrologic element type
rnt           number        16/4                     node type taking into account all stream lines
hnt           number        16/4                     node type taking into acount channel system stream lines
rl            number        16/4                     lines connecting
rupl          number        16/4                     lines connecting ustream
rdnl          number        16/4                     lines connecting downstream
rrl           number        16/4                     lines from reservoir connecting
rrupl         number        16/4                     lines from reservoir connecting upstream
rrdnl         number        16/4                     lines from reservoir connecting downstream
hl            number        16/4                     lines from channel system connecting
hupl          number        16/4                     lines from channel system connecting upstream
hdnl          number        16/4                     lines from channel system connecing downstream
hrl           number        16/4                     lines from channel system and reservoir connecting
hrupl         number        16/4                     lines from channel system and reservoir connecting upstream
hrdnl         number        16/4                     lines from channel system and reservoir connecting downstream
Attribute fields from the stream location attribute table (inftab, ftab) are added to the hydro point attribute table (hpftab, ftab) if such a theme was provided as input data (infound, boolean). Finally the hydro point attribute table (hpftab, ftab) is made editable using the ftab.seteditable request.
Each line in the hydro line theme (hltheme, ftheme) is processed. The shape of the line is converted to a listing of points using the polyline.asmultipoint and multipoint.aslist requests. For the beginning and ending points of the line (hlfp, hltp, points) the existing points in the hydro point theme (hptheme, ftheme) are checked. If no point exists within the tolerance (tol, number) a point is added at that location. Similar to adding a line adding a point is done with the ftab.addrecord and ftab.setvalue requests. The record number of the new point is written to the ‘fphp’ field or ‘tphp’ field of the line in the hydro line theme (hltheme, ftheme).
If a stream location theme (intheme, ftheme) was specified as input data (infound, boolean) the points in that theme are also checked. If a point exists within the tolerance distance (tol, number) of the new point the attribute values of the point in the stream location theme (intheme, ftheme) are written to the attribute fields of the point in the hydro point theme (hptheme, ftheme).
6.4. Identify Sources, Subbasin Outlets and Sinks.
Points located on the boundary line of a subbasin represent the location of source, subbasin outlet or sink elements. Each point in the hydro point theme (hptheme, ftheme) is processed. For each point all the polygons from the subbasin theme (iptheme, ftheme) are checked. The polygon shape (polyshape, polygon) is converted to a (poly)line shape (polylshape, polyline) with the polygon.aspolyline request. The distance from the point (hpshape, point) to the (poly)line (polylshape, polyline) is checked. If it is less than the tolerance (tol, number) then the ‘hectype’ field in the hydro point attribute table (hpftab, ftab) is set to ‘1’.
The channel system consists of the stream lines downstream of hydrologic elements. This is obtained by tracing downstream of the source, subbasin outlet and sink locations established in the previous step.
6.5.1. Create Stream Dictionary.
The stream dictionary (streamdict, dictionary) consists of all the stream lines that are longer than half of the tolerance (tol, tolerance). See Section 5.5 for detailed discussion on the tolerance. The dictionary is structured as shown in Table 6.11.
Position   Value                                        Object Type

key        record number (hlftab, ftab) of stream line  number
0          record number (hlftab, ftab) of stream line  number
To create the stream dictionary (streamdict, dictionary) each record in the hydro line theme (hltheme, ftheme) is processed. The length of the line (hllength, number) is calculated from the list of points making up the line. If length is longer than half of the tolerance (tol, number) the record number of the line is added to the stream dictionary (streamdict, dictionary).
6.5.2. Create Channel Dictionary.
The channel dictionary (channeldict, dictionary) consists of all the stream lines in the stream dictionary (streamdict, dictionary) that are part of the channel system. It has a structure identical to streamdict (dictionary) as shown in Table 6.11.
Each point in the hydro point theme (hptheme, ftheme) is processed. If the point is a source, subbasin outlet or sink (hectype = 1) the analysis proceeds otherwise the next point is processed.
Each line in the stream dictionary (streamdict, dictionary) is processed. If the distance from the beginning point of the line to the point is less than the tolerance (tol, number) the line is downstream of a source, subbasin outlet or sink point and therefore part of the channel system. The hlftab (ftab) record number of the line is added to the channel dictionary (channeldict, dictionary) and the upstream line list (uplist, list) which will be used for tracing (described in the next paragraph). Then the hlftab (ftab) record number of all the lines in the channel dictionary (channeldict, dictionary) are removed from the stream dictionary (streamdict, dictionary). This is done to decrease the number of lines processed for the next point. Figure 6.1 lists the relevant Avenue code.
for each hprec in hpftab
    if (hpftab.returnvalue(hphectypef, hprec) = 1) then
        hpshape = hpftab.returnvalue(hpshapef, hprec)
        for each hlrec in streamdict
            hlshape = hlftab.returnvalue(hlshapef, hlrec)
            hlpoints = hlshape.asmultipoint.aslist
            if (hlpoints.get(0).distance(hpshape) < tol) then
                channeldict.add(hlrec.clone, hlrec.clone)
                uplist = uplist.add(hlrec.clone)
            end
        end
        for each hlrec in channeldict
            streamdict.remove(hlrec)
        end
    end
end
The previous paragraph described how the record number of all the lines downstream of source, subbasin outlet or sink elements are written to the channel dictionary (channeldict, dictionary) and the upstream line list (uplist, list). To identify the complete channel system those lines are traced downstream. The tracing procedure is as follows.
Each line in the upstream line list (uplist, list) is processed. The ending point of the line is compared to the beginning point of all the lines in the stream dictionary (streamdict, dictionary). If the distance between them is less than the tolerance (tol, number) the line in streamdict (dictionary) is downstream of the line in uplist (list) and it’s hlftab (ftab) record number is added to the downstream line list (dnlist, list) as well as the channel dictionary (channeldict, dictionary). Then all the lines from the channel dictionary (channeldict, dictionary) are removed from the stream dictionary (streamdict, dictionary) to reduce processing time for the next line. If no downstream lines are found the process is ended, otherwise the downstream line list (dnlist, list) becomes the new upstream line list (uplist, list) and the procedure is repeated. Figure 6.2 shows the relevant Avenue code.
done = false
while (not done)
    dnlist = list.make
    for each uplrec in uplist
        uplineshape = hlftab.returnvalue(hlshapef, uplrec)
        uplinepoints = uplineshape.asmultipoint.aslist
        updnpoint = uplinepoints.get(uplinepoints.count - 1)
        for each hlrec in streamdict
           hlshape = hlftab.returnvalue(hlshapef, hlrec)
           if (hlshape.asmultipoint.aslist.get(0).distance(updnpoint) < tol) then
               dnlist = dnlist.add(hlrec.clone)
               channeldict.add(hlrec.clone, hlrec.clone)
           end
        end
        for each hlrec in channeldict
            streamdict.remove(hlrec)
        end
    end
    if (dnlist.count = 0) then
        done = true
    end
    uplist = dnlist
end
Each line in the channel dictionary (channeldict dictionary) is processed. The corresponding lines in the hydro line theme (hltheme, ftheme) are assigned hydrologic element type numbers for reaches (hectype = 4).
Lakes are defined by polygons in the stream line layer (iltheme, ftheme). Since this program does not use any pre-existing topology and topology building functions are not directly available in ArcView the lakes are identified from the lines in the hydro line theme (hltheme, ftheme).
In short, the procedure is to look for a diversions in the stream lines. If a diversion is found, each downstream path is traced. If the two paths meet somewhere downstream in a junction a lake is present. The lines constituting the lake are identified by tracing each upstream path from the junction to the diversion. Figure 6.3 illustrates the methodology.
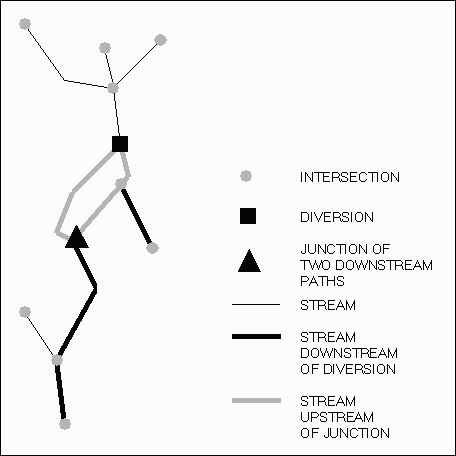
Figure 6.3. Lake Identification Methodology.
Each point in the hydro point theme (hptheme, ftheme) is processed. For each point all the lines in the hydro line theme (hltheme, ftheme) are processed (if they are longer than half the tolerance distance, see Section 5.5). The hpftab (ftab) record numbers of the points located at the beginning and ending points were written to the ‘fphp’ and ‘tphp’ fields in the hydro line attribute table (hlftab, ftab) in the previous step. Those values are checked against the record number of the point. If the line is upstream or downstream of the point a corresponding counter (uplines, dnlines, numbers) is increased by 1. At the end of the loop the counters indicate the number of lines upstream and downstream of the point.
If the number of lines upstream and downstream of the point are one and two respectively the point is a diversion and possibly and upstream end of a lake. If that is the case the hlftab (ftab) record numbers of the two downstream lines are added to a trace list (tracelist, list) which is used to store the hlftab (ftab) record numbers of the lines that are being traced. If it later turns out we are dealing with a polygon this list will contain all the hlftab (ftab) record numbers of the lines belonging to the polygon.
The tracing occurs simultaneously along both (possible) shores of the lake as well as further diversions encountered along the way. The hlftab (ftab) record number of the current lines are stored in the upstream line list (uplist, list). Then each line in the hydro line theme (hltheme, ftheme) is processed. If the hydro point number of it’s upstream end matches the hydro point number of the downstream end of the line from uplist (list) it is added to a downstream line list (dnlist, list). Once all the lines have been processed dnlist (list) becomes the new uplist (list) and the process continues until no more downstream lines are found. During this process all the lines traced are also added to tracelist (list). Figure 6.4 shows the essential downstream lake tracing Avenue code.
tracelist = list.make
tracelist.add(first downstream line of diversion)
tracelist.add(second downstream line of diversion)
uplist = list of downstream lines of diversion
done = false
while (not done)
    dnlist = list.make
    for each uplrec in uplist
        upltphp = hlftab.returnvalue(hltphpf, uplrec)
        for each hlrec in hlftab
            hlfphp = hlftab.returnvalue(hlfphpf, hlrec)
            if (hlfphp = upltphp) then
                dnlist = dnlist.add(hlrec.clone)
                tracelist.add(hlrec.clone)
            end
        end
    end
    if (dnlist.count = 0) then
       done = true
    end
    uplist = dnlist
end
Then a copy of the tracelist (tracelistb, list) is made and the list.removeduplicates request is used to delete all the duplicates in the list. All the records in tracelist (list) are compared to the records in tracelistb (list). If the records don’t match a line was traversed twice indicating a junction in the system. If that occurs it is established that we are dealing with a lake. The hlftab (ftab) record number of the line found to be processed twice is remembered as dnline (number).
If a lake is found as described above all the records in tracelist (list) are traced upstream from the junction point, which is the upstream point of dnline (number). The tracing procedure is in essence the same as the downstream tracing procedure from above. The lines that are part of the lake are stored in tracelistc (list).
All the records in tracelistc (list) are processed. The hectype of the line is multiplied by a factor of 10. Lines that are part of the reservoir therefore have a hectype of 20 or 40 depending on if they are or are not part of the channel system. Further the hpftab (ftab) record number of the downstream point of the lake is written to the ‘lhp’ field of each of the lines.
6.7. Identify Channel Elements.
6.7.1. Set Up Sym Dictionaries.
The sym dictionaries are created for storing the watershed data in the hydrologic data structure before they are written to the sym line and point themes and the HEC-HMS Basin file. The structure of the dictionaries is described in Tables 6.12 through 6.15.
Position  Value    Object Type

key       hecid    number
0         hecid	   number
1         hectype  number
2         hecupid  number
3         hecdnid  number
4         hecupx   number
5         hecupy   number
6         hecdnx   number
7         hecdny   number
Position  Value      Object Type

key       hecid      number
0         hecid      number
1         hectype    number
2         hecupids   number
3         hecdnids   number
4         hecx       number
5         hecy       number
6         hprec      number
Position  Value      Object Type

key       hecid      number
0         hecid      number
1         hecupid 1  number
2         hecupid 2  number
3         etc...     number
Position  Value      Object Type

key       hecid      number
0         hecid      number
1         hecdnid 1  number
2         hecdnid 2  number
3         etc...     number
The hecid (number) variable is initiated by setting it equal to ‘1’.
Each point in the hydro point theme (hptheme, ftheme) is processed. For each point each line in the hydro line theme (hltheme, ftheme) is processed. The length of the line (hllength, number) is calculated. If the length of the line (hllength, number) is larger than half the tolerance (tol, number) the spatial relation of the line to the point is examined. A connection between the beginning or ending point of the line and the point occurs if the distance among them is less than the tolerance distance. The type of the line (channel system, reservoir, etc.) is checked and corresponding counters are incremented. Counters and their matching fields in the hydro point theme (hptheme, ftheme) are listed in Table 6.16. Further description of the counters can be found in Table 6.10.
Variable    Hydro Point Theme Field
rlines      rl
ruplines    rupl
rdnlines    rdnl
rrlines     rrl
rrupllines  rrupl
rrdnlines   rrdnl
hlines      hl
hdnlines    hdnl
hrlines     hrl
hruplines   hrupl
hrdnlines   hrdnl
The node types are calculated and written to the hydro point attribute table (hpftab, ftab) along with the values of the counters. See Section 2.4 for further description of the node types.
The point is checked against the identification criteria of the hydrologic element types. See Table 3.1 in Section 2.4 for a listing of the hydrologic element identification criteria. If the point is a hydrologic element the hecid and corresponding hectype number is written to the hydro point attribute table (hpftab, ftab) and the sym point dictionary (spdict, dictionary). The coordinates of the point are also written to the sym point dictionary (spdict, dictionary). A record is added to the upstream and downstream ID dictionaries (upiddict, dniddict, dictionaries). Lastly, the hecid counter (hecid, number) is incremented by ‘1’.
6.8.1. Reaches and Channel Elements.
In general, connectivity of reaches and channel elements is established by picking a line in the channel dictionary (channeldict, dictionary) that does not belong to a lake and tracing upstream and downstream until a channel element or a reservoir is found. All the lines traced in this way are combined into a single reach by assigning the same hecid (number) to them.
First a dictionary of lines to be processed (processdict, dictionary) is created as a copy of the channel dictionary (channeldict, dictionary). Then a dictionary of all the possible starting points (startdict, dictionary) for the procedure is created by copying channeldict (dictionary) and removing all the lines belonging to a lake. Lines part of a lake are identified by having a non-zero value in the ‘lhp’ field in the hydro line attribute table (hlftab, ftab).
As long as there are records in startdict (dictionary) the following procedure is performed. A reach list (reachlist, list) is created. The first record from startdict (dictionary) is added to reachlist (list). Then the channel system is traced upstream. The tracing procedure is similar to the one used for the lakes.
A downstream line number (dnline, number) is created and assigned the value of the line from startdict (dictionary). The hectype of the upstream point of the line is checked against possible reach upstream end hectype values. The upstream point of a reach can have a hectype of 1 (subbasin outlet), 3 (junction), 7 (source), 8 (diversion) or 10 (reservoir). If the upstream point of the line does not meet the criteria for upstream end of a reach the following tracing procedure is done until an upstream point of a reach or a reservoir is found.
Each line in processdict (dictionary) is processed. The hpftab (ftab) record number of the ending point of the line is compared to the hpftab (ftab) record number of the starting point of the dnline (number). If the numbers match and the line is not part of a reservoir the line is added to reachlist (list). The hectype of the upstream end of the line is checked to see if it is possible upstream end of a reach (hectype 1, 3, 7, 8 or 10). If the upstream end of the line is a possible upstream end of a reach the loop is ended, otherwise continued.
For non-lake upstream ends the hecid value as well as the shape and coordinates of the upstream end are written to memory. For lake upstream ends the reservoir point is found from the ‘lhp’ value of the line. The lines in reachlist (list) are removed from processdict (dictionary) and startdict (dictionary). Figure 6.5 illustrates the relevant Avenue code.
dnline = reachlist.get(0).clone
upfound = false
uplake = false
hlfphp = hlftab.returnvalue(hlfphpf, dnline)
uphectype = hpftab.returnvalue(hphectypef, hlfphp)
if (uphectype = 1) then
    upfound = true
end
if (uphectype = 3) then
    upfound = true
end
if (uphectype = 7) then
    upfound = true
end
if (uphectype = 8) then
    upfound = true
end
if (uphectype = 10) then
    upfound = true
end
while ((not upfound) and (not uplake))
    for each prec in processdict
        hltphp = hlftab.returnvalue(hltphpf, prec)
        if (hltphp = hlfphp) then
            hllhp = hlftab.returnvalue(hllhpf, prec)
            if (hllhp = 0) then
                reachlist.add(prec.clone)
            end
            if (hllhp > 0) then
                uplake = true
            end
            dnline = prec.clone
            break
        end
    end
    hlfphp = hlftab.returnvalue(hlfphpf, dnline)
    uphectype = hpftab.returnvalue(hphectypef, hlfphp)
    if (uphectype = 1) then
        upfound = true
    end
    if (uphectype = 3) then
        upfound = true
    end
    if (uphectype = 7) then
        upfound = true
    end
    if (uphectype = 8) then
        upfound = true
    end
    if (uphectype = 10) then
        upfound = true
    end
end
if (not uplake) then
    hecupid = hpftab.returnvalue(hphecidf, hlfphp)
    hecupshape = hpftab.returnvalue(hpshapef, hlfphp)
    hecupx = hecupshape.getx
    hecupy = hecupshape.gety
end
if (uplake) then
    hecupid = hpftab.returnvalue(hphecidf, hllhp)
    hecupshape = hpftab.returnvalue(hpshapef, hllhp)
    hecupx = hecupshape.getx
    hecupy = hecupshape.gety
end
for each hlrec in reachlist
    processdict.remove(hlrec)
    startdict.remove(hlrec)
end
The same procedure is followed in the downstream direction. Then the lines in reachlist (list) are assigned identical hecid values in the hydro line attribute table (hlftab, ftab). The hecid, hecupid, hecdnid, hecupx, hecupy, hecdnx and hecdny (numbers) values are written to the sym line dictionary (symdict, dictionary). The spdict (dictionary) records of the upstream and downstream elements are updated. The hecid (number) is incremented by ‘1’. The number of lines in startdict (dictionary) is checked with the dictionary.count request. If there are no more possible starting lines the loop ends.
The subbasin elements have to be connected to the corresponding subbasin outlet elements. Each subbasin in the subbasin theme (iptheme, ftheme) is processed. For each subbasin each point in the hydro point theme (hptheme, ftheme) is processed. If the distance from the point to the boundary line of the subbasin is less than the tolerance (tol, number) the point is located on the subbasin boundary. If that is the case the analysis proceeds otherwise the next point is processed.
Each line in the hydro line theme (hltheme, ftheme) is processed. If the ending point of the line is within the tolerance (tol, number) of the point and the line is completely contained in the polygon the point is an outlet of the subbasin. The shape.iscontainedin request is used to check if the line is completely contained in the polygon. The hpftab (ftab) record number of the point is added to the outlet point list (outletlist, list). If there is only one record in the outlet point list (outletlist, list) that point is chosen to be the subbasin outlet. If there are multiple outlet points to the subbasin the first point is chosen to be the subbasin outlet, unless an elevation grid was specified as input data (igfound, boolean). If an elevation grid was supplied the subbasin outlet is determined as described in the next paragraph.
For subbasins with multiple outlets a choice has to be made as to which outlet is the subbasin outlet. The elevation of the point is used as criteria. The outlet with the lowest elevation is chosen to be the subbasin outlet. The elevation of the point is extracted from the elevation grid (igtheme, gtheme) with the gtheme.returncellvalue request.
6.9. Create Sym Line Shape File.
The file name for the sym line theme (sltheme, ftheme) is created with the project.makefilename request, and the ftab is created using the ftab.makenew request. The shape field (slshapef, field) is obtained with the ftab.findfield request. A number of working fields are added to the sym line attribute table (slftab, ftab) as listed in Table 6.17.
Field Name  Field Type  Field Length/Precision  Description
hecid       number      16/4                    ID
hectype     number      16/4                    hydrologic element type
hecupid     number      16/4                    ID of upstream element
hecdnid     number      16/4                    ID of downstream element
hecupx      number      16/4                    x coordinate of upstream element
hecupy      number      16/4                    y coordinate of upstream element
hecdnx      number      16/4                    x coordinate of downstream element
hecdny      number      16/4                    y coordinate of downstream element
If attributes are transferred as indicated by attrib (boolean) the attribute fields specified in the reach attribute transfer table are also added to the sym line attribute table (slftab, ftab). The field type, length and precision is copied from the stream line attribute table (ilftab, ftab).
Lines are added to the sym line theme (sltheme, ftheme) based on the sym line dictionary (sldict, dictionary). The ftab.addrecord and ftab.setvalue requests are used to add a line. Attribute values from the lines in the stream line attribute table (ilftab, ftab) are transferred to the attribute fields in the sym line attribute table (slftab, ftab) based on the reach attribute transfer table. See the discussion in Section 5.4 for a detailed description of the reach attribute transfer methodology.
6.10. Create Sym Point Shape File.
6.10.1. Set Up Sym Point Theme.
The file name for the sym point theme (sptheme, ftheme) is created with the project.makefilename request, and the ftab is created using the ftab.makenew request. The shape field (spshapef, field) is obtained with the ftab.findfield request. A number of working fields are added to the sym point attribute table (spftab, ftab) as listed in Table 6.18.
Field Name  Field Type  Field Length/Precision  Description

hecid       number      16/4                    ID
hectype     number      16/4                    hydrologic element type
hecupids    number      16/4                    number of upstream elements
hecdnids    number      16/4                    number of downstream elements
hecx        number      16/4                    x coordinate
hecy        number      16/4                    y coordinate
If attributes are transferred as indicated by attrib (boolean) the attribute fields specified in the subbasin, junction, diversion, reservoir, source and sink attribute transfer table are also added to the sym line attribute table (slftab, ftab). The field type, length and precision is copied from the input attribute tables.
Points are added to the sym point theme (sptheme, ftheme) based on the sym point dictionary (spdict, dictionary). The ftab.addrecord and ftab.setvalue requests are used to add a point. Attribute values from the polygons in the subbasin polygon attribute table (ipftab, ftab) and the stream location point attribute table (inftab, ftab), if provided, are transferred to the attribute fields in the sym point attribute table (spftab, ftab) based on the element attribute transfer table. See the discussion in Section 5.4 for a detailed description of the reach attribute transfer methodology.
The attribute tables of the sym line and point themes (sltheme, sptheme, fthemes) are linked to the attribute tables of the hydro line and point themes (hltheme, hptheme, fthemes), respectively. The link is based on ‘hecid’ and established using the ftab.link request.
6.12. Create HEC-HMS Basin File.
Set Up File: If the hmsmode (string) run control variable is set to ‘d’, the filename for the HEC-HMS Basin file (hmsfilename, filename) is created with the project.makefilename request, otherwise the value of hmsmode (string) is used to create the hmsfilename (filename) with the string.asfilename request. The HEC-HMS Basin file (hmsfile, file) is created using the linefile.make request.
Write Header: The file header is written. The date and time is obtained from the system using the date.now request. The units system is set as ‘unknown’. Data are written to the file one line at a time using the file.writeelt request
Write Element Data: Element data are written to the HEC-HMS Basin file based on the sym line and point themes (sltheme, sptheme, fthemes). See the discussion in Section 5.4 for a detailed description of the attribute transfer methodology.
Close File: The HEC-HMS Basin file (hmsfile, file) is closed by sending it the file.close request.
The attribute tables of the hydro and sym line and point themes (hlftab, hpftab, slftab, spftab, ftabs) are closed or made non-editable using the ftab.seteditable request.
Go to: Short Table of Contents, Long Table of Contents, HECPREPRO Page.
Bhaskar, N. R., James, W. P., Devulapalli, R. S., Hydrologic Parameter Estimation using Geographic Information System, Journal of Water Resources Planning and Management, vol. 118, no. 5, p. 492-512, 1992.
Charley, W., Pabst, A., and Peters, J., The Hydrologic Modeling System (HEC-HMS): Design and Development Issues, Technical Paper No. 149, Hydrologic Engineering Center, US Army Corps of Engineers, June 1995.
DeVantier, B. A., and Feldman, A. D., Review of GIS Applications in Hydrologic Modeling, Journal of Water Resources Planning and Management, vol. 119, no. 2, p. 246-261, 1993.
Environmental Systems Research Institute, Inc. (ESRI), ARC/INFO Version 7.0.4, Redlands, CA, 1996.
Environmental Systems Research Institute, Inc. (ESRI), ArcView GIS Version 3.0, Redlands, CA, 1996.
Environmental Systems Research Institute, Inc. (ESRI), What is a GIS, http://www.esri.com/base/gis/abtgis/what_gis.html, 5/21/97, 1997.
Fisher, G. T., Geographic Information System/Watershed Model Interface, Proceedings of the 1989 National Conference on Hydraulic Engineering, ASCE, New York, 1989.
Hydrologic Engineering Center (HEC), HEC-HMS: Hydrologic Modeling System, User’s Manual (DRAFT), Hydrologic Engineering Center, US Army Corps of Engineers, Davis, California, September 1996.
Innovative System Developers, Inc., Geo-STORM Hydrology, Version 1.5 Beta, Columbia, MD, 1995.
Maidment, D. R., Developing a Watershed Data Structure, prepared for the Hydrologic Engineering Center, US Army Corps of Engineers, Davis, Calif., under Contract DACW05-92-P-1864, April 9, 1993.
Maidment, D. R., GIS and Hydrologic Modeling - an Assessment of Progress, The Third International Conference on GIS and Environmental Modeling, Santa Fe, New Mexico, 1996.
Mizgalewicz, P. J., and Maidment, D. R., The SAST Flood Water Balance (1993), Center for Research in Water Resources, University of Texas at Austin, September 9, 1996.
Moore, I. D., Hydrologic Modeling and GIS, in Environmental Modeling with GIS, editors Goodchild, M. F., Parks, B. O., and Steyaert, L. T., Oxford University, New York, 1993.
Olivera, F., McKinney, D. C., Maidment, D. R., Ye, Z., and Reed, S., Mean-Annual Water Balance of the Niger River, West Africa: Predicting the Water Balance of Surface and Ground Water Resources Over Large Areas, UNESCO Symposium on Runoff Computations for Water Projects, St. Petersberg, Russia, Oct. 30 - Nov. 3, 1995.
Olivera, F., Maidment, D. R., and Charbeneau, R. J., Spatially Distributed Modeling of Storm Runoff and Non-Point Source Pollution Using Geographic Information Systems, Center for Research in Water Resources, The University of Texas at Austin, 1996.
Peters, J., The HEC Hydrologic Modeling System, Technical Paper No. 150, Hydrologic Engineering Center, US Army Corps of Engineers, November 1995.
Reed, S., Maidment, D., Patoux, J., Spatial Water Balance of Texas, Center for Research in Water Resources, The University of Texas at Austin, 2/23/97.
Saghafian, B., Implementation of a Distributed Hydrologic Model within GRASS, GIS and Environmental Modeling: Progress and Research Issues, Goodchild, M. F., Steyaert, L. T., Parks, B. O., Johnston, C., Maidment, D., Crane, M., Glendinning, S., Editors, GIS World Books, Fort Collins, CO, 1996.
Shea, C., Grayman, W., Darden, D., Males, R. M., Sushinsky, P., Integrated GIS and Hydrologic Modeling for Countywide Drainage Study, Journal of Water Resources Planning and Management, vol. 119, no. 2, p. 112-128, 1993.
Smith, P. N., and Maidment, D. R., Hydrologic Data Development System, CRWR Online Report 95-1, Center for Research in Water Resource, The University of Texas at Austin, Austin, TX, 1995.
Stuebe, M. M., Johnston, D. M., Runoff Volume Estimation Using GIS Techniques, Water Resources Bulletin, vol. 26, no. 4, p. 611-620, 1990.
Warwick, J. J., Haness, S. J., Efficacy of ARC/INFO GIS Application to Hydrologic Modeling, Journal of Water Resources Planning and Management, vol. 120, no. 3, p. 366-381, 1994.
Go to: Short Table of Contents, Long Table of Contents, HECPREPRO Page.