CE 394K-3 GIS IN WATER RESOURCES
Developing Watershed Model For Euphrathes-Tigris Basin
Objective:This basin has been the source of conflicts between Turkey, Syria and Iraq for about 25 years. The time after Turkey began to construct the dams (GAP) on these rivers, this dispute took the first place on agenda for both sides. Both countries consider the dispute as a political issue and try to persuade the others by threatening using the other political constraints. I believe that the solution can be approached by excluding the problem from all disputes which kept both sides away from a profound look to the issue.
A technical study is required for the indication of the resources available on this basin. Research for land and water resources is needed for the distribution of water for optimum needs. Distributing the water according to needs requires location of water rights on that basin. These steps may be accounted as the ones that must be followed for that kind of technical study. If so, using GIS will be an appropriate proposal for this procedure. Because, by attributes of GIS, we are able to represent all relevant data by databases and develop models faster and with high accuracy.
I hope this project can be the first attempt of the first step for that sort of technical study.
TABLE
OF CONTENT
I)
MIDDLE EAST
II) DATA
SET
a) Digital Chart of The World
b) Digital Atlas of The World Balance
III) METHODOLOGY
a) Processing DCW Coverages
b) Processing
The Data From Digital Atlas Of The World Balance
IV) DISCUSSION
OF ERRORS
V) CONCLUSION
VI) FUTURE
WORK
VII) REFERENCES
MIDDLE EAST
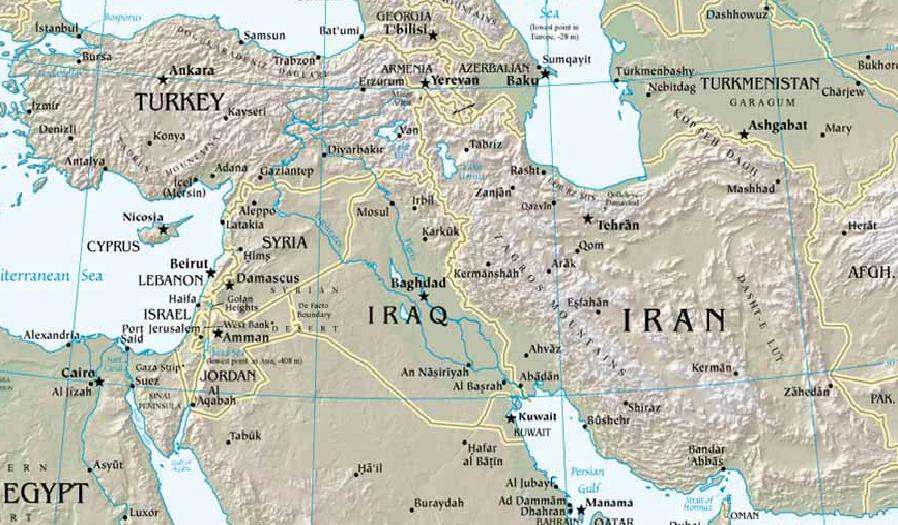
This Middle East map shows us the location of Euphrates-Tigris. Euphrates which is result of merging two rivers, Murat and Perisuyu, at province of Elazig flows through Syria then Iraq.Tigris originates from province of Diyarbakir flows through Iraq after passing on borders of Turkey and Syria. These two rivers merge in territories of Iraq close to province of Al Basrah and become to a channel called "Sath ul Arap". The channel of Sath ul Arap becomes the border of Iraq and Iran after Al Basrah, passes through Abadan and finally drains to Persian Golf.
The importance of the Euphrates-Tigris
basin comes from being the source of conflicts on distribution of the waters
of rivers among three countries: Turkey, Iraq and Syria.The crise especially
increased after Turkey started to construct a couple of dams on these rivers
under the name of "South Anatolia Project".Nowadays, it is not surprise
to read conspiracy theories about probable results of conflicts on this
water issue which is an apparent evidence coming up "Water wars" in 21
century.
DATA
SET
Two different data set were used in this project.
A) Digital Chart of World
B) Digital Atlas of World Balance
A) DIGITAL CHART OF WORLD (DCW)
Digital
Chart of World is a set of GIS Data covering the whole world.This data
set is originally developed for US Defense Agency(DMA) using the aeronautical
charts. Data set is composed of coverage for different landmarks important
from flying altitudes. All coverages are files in export format ready for
use in Arc Info, Arc View. Data set is developed in a scale of 1:1000000
and in Geographic Coordinates. The whole data set is a product of
an Environmental Systems Research Institute (ESRI). Data set is composed
of various coverages which are prepared in country bases. Information for
each country according to continent it is located can be downloaded easily
from WEB. The coverage for each country in this data set is listed in a
table below:
| Available Themes | Type | Coverage Name |
| Political/Ocean | Network | PONET |
| Populated Places | Polygon | PPPOLY |
| Populated Places | Point | PPPOINT |
| Railroads | Line | RRLINE |
| Roads | Line | RDLINE |
| Utilities | Line | UTLINE |
| Drainage | Network | DNNET |
| Drainage | Point | DNPOINT |
| Drainage Supplemental | Point | DSPOINT |
| Hypsography | Network | HYNET |
| Hypsography | Line | HYPOINT |
| Hypsograhpy Supplemental | Line | HSLINE |
| Hypsograhpy Supplemental | Point | HSPOINT |
| Land Cover | Polygon | LCPOLY |
| Land Cover | Point | LCPOINT |
| Ocean Features | Point | OFPOINT |
| Ocean Features | Line | OFLINE |
| Physiograhpy | Line | PHLINE |
| Aeronautical | Point | AEPOINT |
| Cultural Landmarks | Polygon | CLPOLY |
| Cultural Landmarks | Point | CLPOINT |
| Cultural Landmarks | Line | CLLINE |
| Transportation Structure | Line | TSLINE |
| Transportation Structure | Point | TDPOINT |
| Vegetation | Polygon | VGPOLY |
B) DIGITAL ATLAS OF THE WORLD BALANCE
Digital
Atlas of the World Balance is a set of Global data compsed of Drainage
Basin files, Digital Elevation model (DEM), Flow Direction, Flow Accumulation,
Flow length Grids.Data set was prepared from 30"arcsecond DE. It is in
Lambert Azimuthal projection and prepared by CRWR,UT.The data set is provided
in CD-ROM.
I)
Drainage Basins: Basins are delineated for
sections of coastlines.They actually delineation of the portion of land
draining to the corresponding coastline or ocean.
II)
Modified Terrain Grid: They are derived from
the original DEM and presented in lambert azimuthal projection.Grids were
already filled so that they can be used directly with causing interrupted
flow over the land surface.
III)
Flow Accumulation Grid: This grid shows the
number of the cells upstream of a given cell. It is used in constructing
a river network by specifying the threshold, minimum number of the cells
that is used to identify the starting point of each river reaches.
IV)
Flow Direction Grid: This grid is used to
identify the direction of the flow in one cell in eight direction by using
the numbers:1, 2,4,8,16,32,64,128.The idea behind this kind of modeling
is that water flows to downhill and in the direction of steepest decent.
V)
Flow Length Grid: Flow length grids provide
the distance that has to flow get to the basin outlet. These flow lengths
are given in kilometers in CD-ROM.
Here you see these
four grids and Drainage Basin file for Europe.
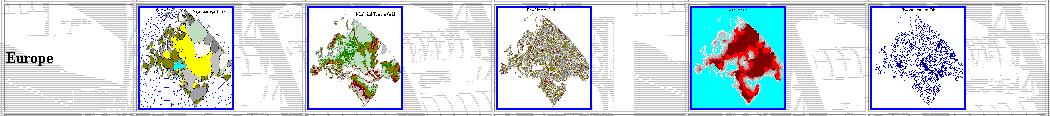
Drainage Basins
DEM
Flowdir
Flowlength
Flowacc
I) First step: In the first step of the project, Drainage Network Coverage from Digital Chart of the World was downloaded. In order to download this coverage, in the first place the continent where the interested country located was selected, then name of the country was specified. After identifying the country ,the coverage which we interested in was selected as "Drainage". After indicating the kind of the computer system that will be used, the data was downloaded to a working directory. Since the data was given in export format, it was processed by Import 71 and got ready to be used by Arc View.
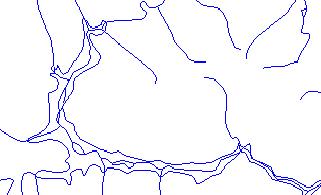
The steps listed above were repeated five times for five countries: Turkey, Iraq, Iran, Syria and Saudi Arabia since the basin of Euphrates-Tigris comprises territories from these five countries. Here what is noticeable is that there are two different files under coverage of "Drainage Network": Dnnet, Ponet. Dnnet represents the drainage network in that country, where as Ponet represents the line coverage which is specifying borders of the countries. If you retrieve these files in Arc View as theme, you can see that these two files as two different themes showing networks and borders of the countries.The picture below shows the Drainage Networks for five countries:
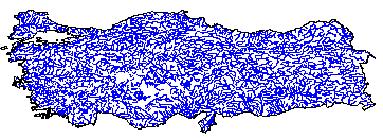
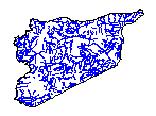
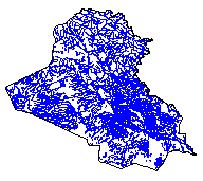
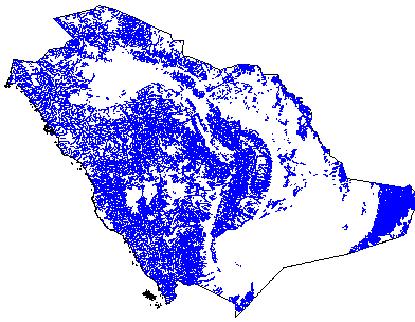
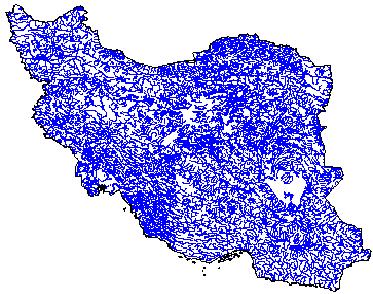
In the pictures above Dnnet files shown in blue are representing the river network in those country.If you look at the pictures carefully, you will notice black line which is Ponet file showing the countries borders.
2)
Second Step: Next step is merging the coverage
above to get a continuous drainage network. Remember, Euphrates and Tigris
are tranboundary rivers which requires a merging operation. For merging,mergthm.ave
script was used. In order do that process, dnnet themes for each country
highlighted in Arc View and then mergthm.ave was run. After merging,
one coverage theme was generated as a result of merging showing the merged
network. After merging, It was time to change the projection of the coverage
from Geographic Coordinates to Lambert Azimuthal projection, since DEM
and other grids are in Lambert Azimuthal projection. The converting text
file was shown below.It is the script format for the conversion in Arcview.
The projection conversion in the drainage network was done by using the
entities of Arc View. From Extensions 'Projector' entity ![]() was selected,'Central
was selected,'Central
INPUT
PROJECTION GEOGRAPHIC
UNITS DD
PARAMETERS
OUTPUT
PROJECTION LAMBERT_AZIMUTH
PARAMETERS
6378137.00000
20 0 0
55 0 0
0.0
0.0
END
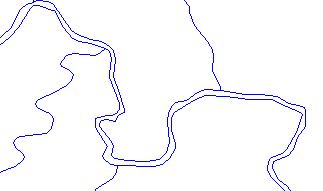
Meridian' and 'Referance Latitude' were specified as 20 and 55 respectively. The picture below shows the merged and projected coverage.

3)
Third Step: This step was the most important
and time consuming process in this project.What was done here is delineating
the Euphrates and Tigris river network from these bunch of river 'garbage!'.
In order to delineate the correct river network, the geographic map of
the countries were used. 'Edit' ![]() entity of the Arc View was used to delete the river reaches which
are closer but not element of the original river network and small reaches
of the network since it was expected in this project to work with a considerable
scale.
entity of the Arc View was used to delete the river reaches which
are closer but not element of the original river network and small reaches
of the network since it was expected in this project to work with a considerable
scale.
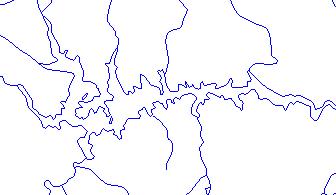
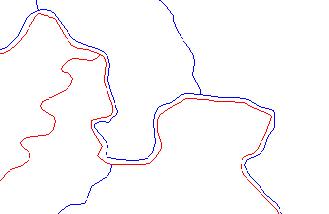
Three different problems are listed above in this deleting process. First difficulty was faced where river network was merging with the reservoirs. In the first picture above, river is merging with reservoir.Since the reservoir was long and narrow, rather than drawing a line that will represent the river network, omitting one of the borders of the reservoir was preferred. Second problem was two lines representing the main body of the river. Since Euphrates and Tigris were getting larger with in the borders of Iraq, I had to delete one of the lines and make the other line represent the river reach. The third situation which is shown in the figure above relatively simple and interesting. In this case, a line passing through the reservoir can be seen. This line makes the things easy because it was selected as the line representing the river network at that point.
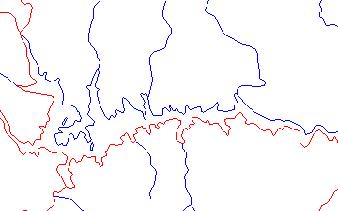
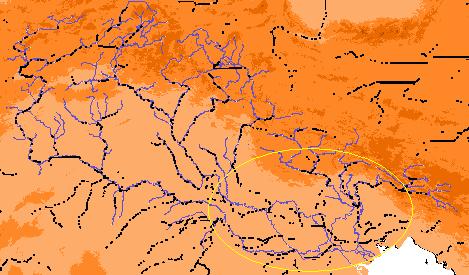
The picture below shows the delineated river network from Dnnet coverage:
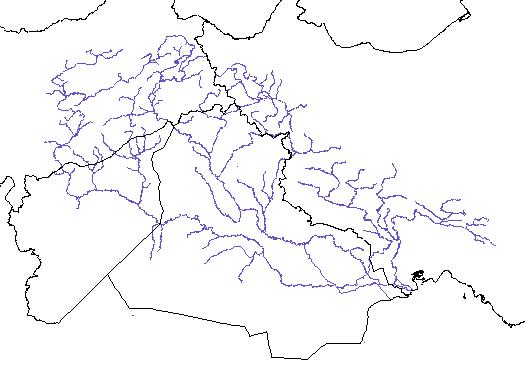
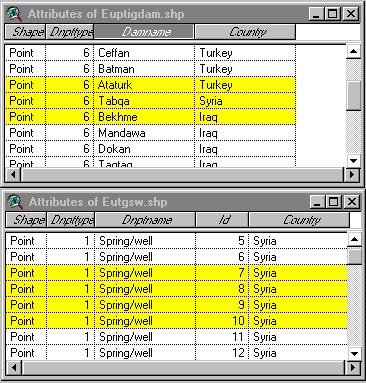
4) Fourth Step: In the fourth step of processing the data, I downloaded 'Dnpoint' which is representing the Drainage Point Coverage from the Digital Chart of the World.Drainage Point coverage represent the Hydraulic Structures at each countries.The list of the hydraulic structures at countries are listed from 1-6 each representing different structures from Wells/Springs to dams. This data was also stored in export format and must be converted import format. The same procedures with 'Dnnet' coverage must be followed, which are merging and changing the projection in order to be make data able to be used with DEM. The figure below shows the merged and projected theme in Arc View. Although this data contain different hydraulic structures, in the general Dnpoint data all hydraulic structures were shown in the same color.This data were intersected with Euphrates-Tigris basin file and the hydraulic structures in this basin were shown after that intersecting process. At this stage, it is better to remind that, since there are six hydraulic structures stored in data, for the countries whose part of territories covered by Euphrates-Tigris basin, there are two hydraulic structures were presented in data: Dams and Wells/springs.

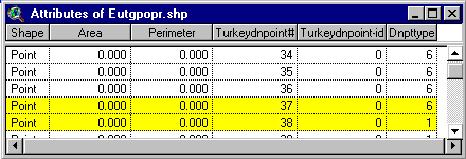
You may see that there are two
different hydraulic structures in this data if you look at the Attribute
table of the Eutgpopr.shp theme
B)
PROCESSING THE DATA FROM DIGITAL ATLAS OF THE WORLD BALANCE
1) First Step: First
step at processing the data from digital chart of the world was extracting
the Euphrates-Tigris Basin from the Drainage Basin file. Drainage Basin
file that I used covers the basins in Europe and Asia.This file is
also in export format with other files in this data set like the coverage
in DCW.Therefore before processing this data set, export format converted
to import format by 'Import 71' . There are about 3000 big basins
represented in this file. This file is the only shape file among other
files (DEM,Flowacc, Flowdir...)This simple extracting process was done
by Query ![]() entity.First
the identity of the basin was determined before going through the extracting
process by identify tool
entity.First
the identity of the basin was determined before going through the extracting
process by identify tool ![]() .After completing identifying operation,the theme was highlighted and Basin
was identified according to this ID number.The query operation and selected
basin was shown below:
.After completing identifying operation,the theme was highlighted and Basin
was identified according to this ID number.The query operation and selected
basin was shown below:
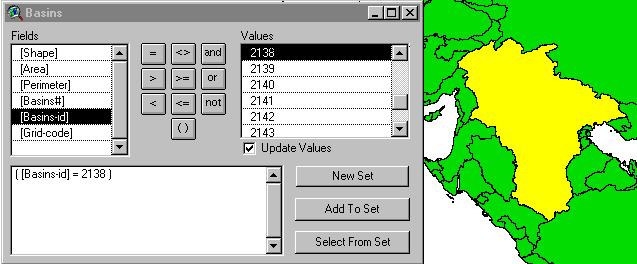
As it is seen from the figure above, the
basin-id was equated to 2138 which is the number representing the Euphrates-Tigris
basin.
2)
Second Step: Second step in this project was
downloading the DEM and other grids from Digital Atlas of World Balance.
They were both in the export format and converted to import format by 'Import
7.1'. My first intention in downloading this data was processing the sub-watershed
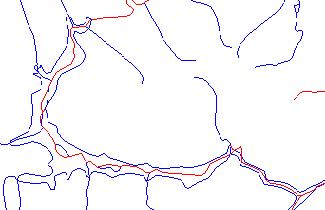
delineation processed the Flowacc grid to get 'constructed river network'
file. I gave a threshold of 5000 for the constructed network. It can be
noticed from the picture below that constructed river network was less
branched when compared with the Drainage Network.Then I passed to second
stage of sub-watershed delineation which is processing DEM to get
the 'Burned DEM' grid. I burned the stream network in the DEM and compared
the constructed river network with the Drainage network. The result that
I came up surprised me, because although at the upper parts of the basin
constructed river network was exactly coinciding with the Drainage network,
at lower parts of the basin , constructed river net work diverging from
the usual river network:
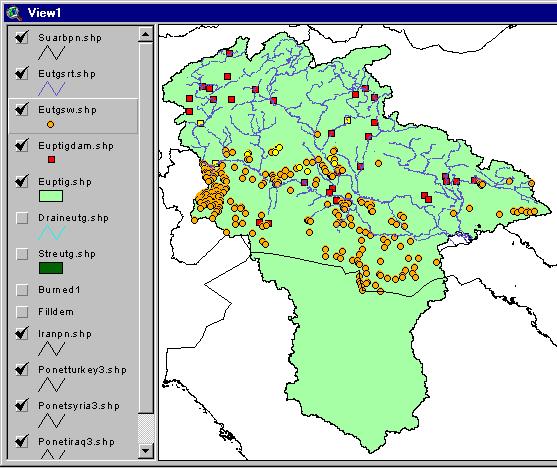
Final Step: After coming up with the constructed different from the Dnnet coverage, the remaining steps to delineate the sub-watersheds were not processed, because the program gave errors and did not process the next step which ic 'add lines'. I tried to add the dnnet coverage river reaches which are out of the constructed river system, since the system gave error in add lines, I had to leave this process and focused on the data that I downloaded from DCW. My next and last intention was to present the hydraulic structures in separate themes for Euphrates-Tigris basin. In order to cover this scope, I intersect the dnpoint theme that I came up by merging the dnpoint themes for each countries with Euptg.shp theme which was representing the basin that we interested. I came up with theme representing the points for Euphrates-tigris basin.Then, I processed this theme by query tool and separate the dnpoint file into two different themes since there were only two hydraulic structures represented in this coverage. After separating the theme, I made some arrangements in the attributed tables.In the attribute table of the Dams, I added new fields like countries and Dam names, then I entered the names of the countries and dams according to the real map displaying the river reaches and dams located on these river reaches.Here the problem was ; in the original attribute tables dams and spring/wells represented by numbers for each countries and there were no information about the numbers and the structures that they are representing. In the Dnpoint coverage, there was a text file showing the names of the structures, but there were again no matchment among numbers and names in the text file. Therefore, I had to find the names corresponding to those numbers by highlighting the numbers from table.By doing so, I tried to catch the sequence of labeling by numbers. Finally, according to that sequence, I filled the attribute table with names. In the figure you see the basin theme extracted from the Drainage basin, Dnnet river network, hydraulic structures: Dams and wells/springs as a different themes:
The data that used in this project has been developed recently, and I think that it is still having some mysteries with itself. At the beginning of the description for Digital Chart of World, I talked about the data sources.The digital Chart of the World was not developed from a data that was produced only for uses in Arc View.Therefore it is possible to see some imperfections in the data when it is displayed in ArcView.One of them is wrong Dam Locations for the dams that are in Iraq closer to Jordan. It can be seen from the picture that these two rivers are not on any river reach. From the real map of Iraq it can be seen that there are no rivers going to these locations.
Second imperfection in DCW data is in dnnet coverage. If one enlarge the network theme for any particular point, he may see that there are lots of river reaches that are not connected to each other, just beginning randomly from any point and finishing at any point which indicates the unrealistic situation.
Most important of all, divergence of the constructed river network from the dnnet river network indicates that something was represented unrealistically in this digital data or by processing this digital data. One reason of this divergence may be the flow of the water on grid. Two converging river reaches can be represented by grids , but two diverging reaches can not be represented by grid since flow of water in grid is from one grid to another by following the steepest path which means the water prefers the the steepest path of two or more diverging reaches. Delineating the watershed according to constructed river network may cause the problem due to behavior of the flow from one grid to an other. On the other hand delineating the watershed according to dnnet river network is questionable when the divergence of it from the constructed river network. Moreover, 'add lines' entity of the prepro did not work and the process of adding the river reaches that are not on constructed network gave error.
One other theory for the divergence can be the problem in the snapping of the reaches together or producing new river reaches and connecting them to network already available.Because inconsistency of the dnnet coverage may effect the constructed network.
The error messages from the Arc View probably due to imperfections in the data effected the project scope. Failure in the delineation of the sub-watersheds make me modify the main object of the project which was producing the basin file that can be used in Hydrologic modeling in HMS.
Working with these kinds of data may cause problem of ' available space' since both original and generated files may occupy large place in the working directory. This was one of the drawbacks that I faced during this project. During run of Arc View, the process was stopped by software giving 'available space'
Working with DEM takes long duration. In order to decrease the running time and increase efficiency, DEM must be cut according to the basin of the region. Cutting DEM also decrease the probability of computer crashing.
Since the data is raw and the region is large, besides the displaying of the objects more valuable work can be done on that basin by using this data. The importance of the region comes from the conflicts on the distribution of the water, most probable solution to this conflicts requires the evaluation of the water precipitated in this basin through out the year. Using HMS enables us to find the amount of water available at any point of the region. Another step for a optimum distribution of water may require the evaluation of the land resources, since the water available in this basin mainly utilized in domestic usage and irrigation. Any study for land resources requires soil and plant vegetable coverage data. Vegetation data look likes to be available, but we need detail soil data.
After maximizing the usage of water for this basin, distribution of this available water becomes important. Location of the Water rights points into this basin looks like the most valuable study on this basin. This is really big challenge.
Digital Atlas of The World Balance
http://www.crwr.utexas.edu/gis/gishydro99/atlas/Atlas.htm
Digital Chart of The World
http://www.maproom.psu.edu/dcw
Creating a river network
http://www.crwr.utexas.edu/stu/asanteko/dcw/rivernet.htm