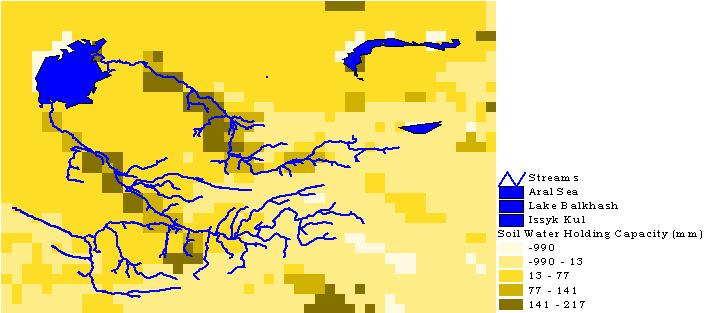
In order to calculate a soil water budget of the area, I obtained data from the CD ROM of The Digital Atlas of the World Water Balance published by the Center for Research in Water Resources. The CD ROM contains 30 by 30 arcsecond cells for precipitation, temperatures, water holding capcity, and radaition for the whole world. The figure below show the water holding cpacity in millimeters for the area. Notice how the land on which the rivers closest to the delta have a much higher water holding capacity.
Figure 18: Soil Water Holding Capacity (mm)
The figure below shows the average temperature in Celsius degrees for the area. (Click on the figure to see an animated version of the temperatures)
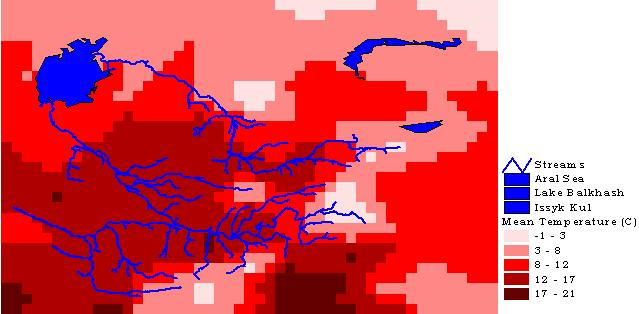
Figure 19: Average Temperatures (C)
The figure belows show the monthly net average radiation in watts per square meter.(Click on the figure to see an animated version of the radiation)
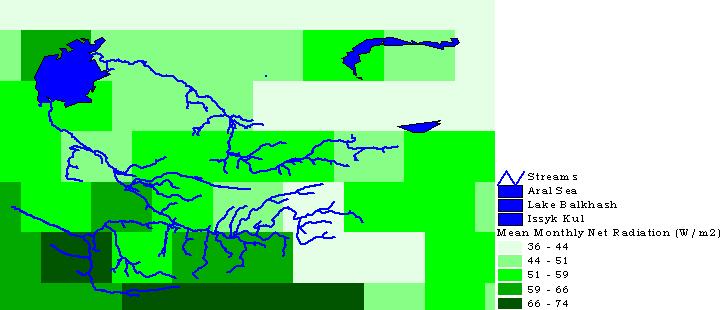
Figure 20: Mean Monthly Net Radiation (W/m2)
The figure belows show the annual precipitation in millimeters. (Click on the figure to see an animated version of the precipitation)
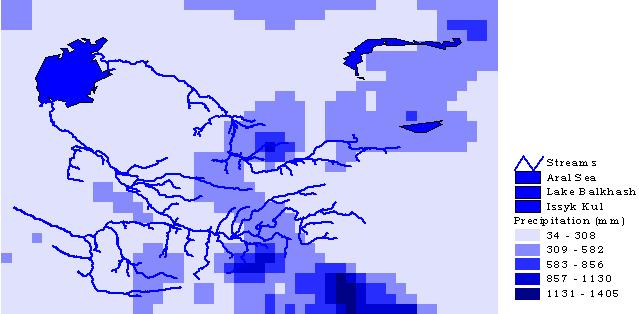
Figure 21: Annual Precipitation (mm)