djanderson@mail.utexas.edu
![]()
![]()
![]()
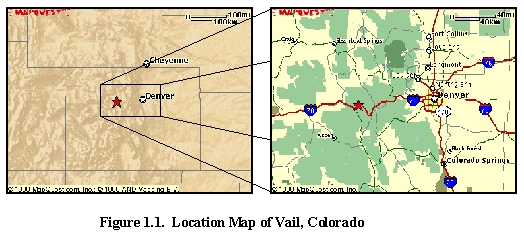
This term project is prepared in direct
response to the high degree of scrutiny surrounding the ongoing development of the Vail
Valley, located in Eagle County, about 90 miles west of Denver, Colorado (Figure 1.1). As
further development of our natural resources in this area occurs, it is important that a
"checks and balances" system be put in place to monitor growth and ensure that
our natural resources are protected. This includes the quality of the streams and
waterways, which should continue to provide adequate aquatic ecosystems and wildlife
habitat, as well as recreation areas for the human population. The proposed Category III
expansion is an excellent example of a project that deserves heightened observation.
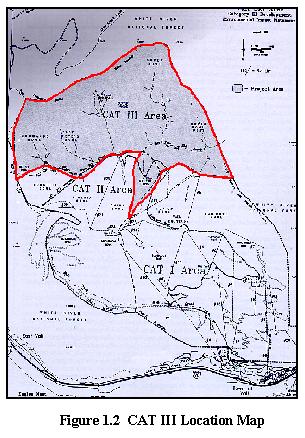
In 1985, Vail Associates, Inc. (VA) contacted the United States Department of Agriculture – Forest Service (Forest Service) and proposed to develop the Category III (CAT III) and Tea Cup Bowl areas on the White River National Forest (WRNF) as part of the Vail Ski Area Master Development Plan (MDP) (Figure 1.2). This 4,100-acre area is a currently undeveloped portion of VA’s existing Special Use Permit area. The Forest Service accepted the MDP after preparation of an Environmental Assessment (EA) and Decision Notice (DN) in 1986. However, the DN withheld approval of the development of the CAT III area pending the completion of a site specific Environmental Impact Statement (EIS). The final EIS was completed in August 1996.
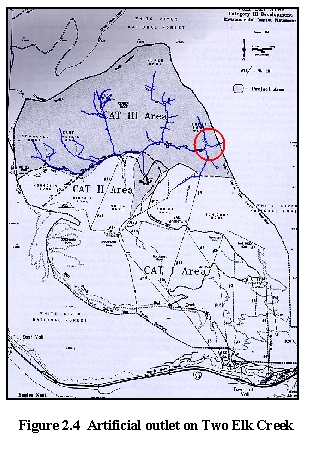
Although VA’s proposal identified several development scenarios for the CAT III area, it focused on the one alternative in particular (the Proposed Alternative) which would add approximately 850 acres of lift-accessed ski terrain to the Vail Ski Area. Primary elements of the proposal included the construction of four ski lifts, ski trails, a skiway/road system, a restaurant, two warming shelters and food service facilities, ski patrol facilities, utilities, and three bridges spanning Two Elk Creek. In short, significant loss of vegetation in the CAT III area will occur if the EIS is approved, and this will affect the quantity and quality of surface (and ground) water in the immediate area.
Pioneer Environmental Services Inc. of Logan, Utah conducted mapping and geographical analysis of the CAT III expansion in 1995. Although preliminary hydrologic modeling on the watersheds and sub-basins within the CAT III area was completed for the EIS using standard mapping tools and modeling software developed by the
Hydrologic Engineering Center (HEC) of the U.S. Army Corps of Engineers (HEC-1), it is the intent of this term paper to investigate the effects that the development will have on the hydrologic system of the CAT III area using watersheds delineated and runoff calculated with ArcView and ArcInfo GIS software provided by the University of Texas at Austin. This term paper is intended to focus on the following objectives:
back to top
![]()
Geographical Information Systems (GIS) provide the tools necessary to delineate watersheds throughout the United States and, in many cases, throughout the world. Based on existing electronic data available over the internet, GIS tools are able to delineate a particular watershed by creating a grid over the area of interest that has three-dimensional data, thereby allowing the calculation of watershed area, flow direction in each grid based on elevation data, and the generation of a stream network in the sub-basin. ArcInfo is a powerful GIS tool used to create GIS data, while ArcView is a particular GIS tool that is capable of manipulating existing GIS data. The University of Texas at Austin (UT) Center for Research in Water Resources (CRWR) is currently developing ArcView processing tools to accomplish these tasks.
The first step taken to determine the effects of vegetation loss on the Two Elk Creek watershed annual runoff was to determine the areal extent of the watershed that would be impacted by timber clearing for development of the CAT III area. Digital Elevation Models (DEMs) are the first step in determining the limits of the watershed using GIS tools. DEMs are packets of data encompassing a prescribed area that provide three-dimensional data, much like an electronic topographic map of the area. A DEM consists of a sampled array of elevations for ground positions that are normally at regularly spaced intervals.
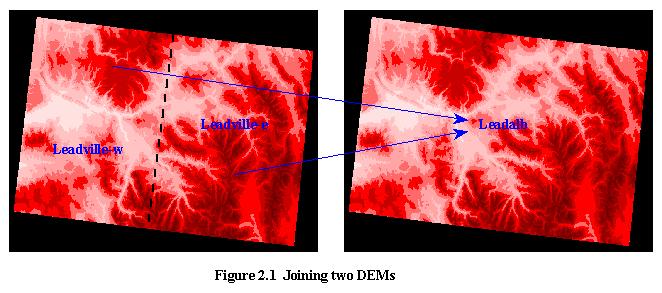
Two DEMs were downloaded from the Unites States Geographical Survey (USGS) web site that each covered a 1-degree by 1-degree area and together would encompass the anticipated extent of this project (http://edcwww.cr.usgs.gov/doc/edchome/ndcdb/ndcdb.html ). 1:250,000-Scale DEMs were selected based on the coverage of the CAT III area they provide (1:250,000 scale equates approximately to 90 meter by 90 meter cell coverage of the area of interest, which in real terms is an area of approximately 18 acres). Leadville-e and Leadville-w DEMs were downloaded and processed using the following steps:
Figure 2.1 presents the process of merging two 1-degree by 1-degree DEMs to form a seamless 2-degree by 1-degree DEM.
The next step in the process was to determine what parameters were used to project three-dimensional data (that accounts for the curvature of the earth) onto a flat map surface. In order to determine the projection used for the Leadville DEMs, a MetaData file was consulted. This file contains data describing the DEMs in detail, such as the origin of the data, a description of the data in words, use constraints for the data, data quality information, accuracy information, and spatial reference information, which describes the map projection used for the DEMs.
The Leadville DEMs were projected using the geographical coordinate system (Latitude and Longitude) using the World Geodetic Survey of 1984 (WGS84). Elevations were specified in meters. It was determined to project the Leadville DEMs using the Albers Conical Equal Area projection, which is easier to work with and a more accurate projection used for the conterminous United States than other map projections. The input and output parameters were specified in ArcInfo by starting the program and specifying the working directory. The Project command was then used, which identifies the input projection (in this case, geographical WGS84) and the user can then specify the output projection (Albers Conical Equal Area). The following text was input into ArcInfo:
project cover leadville leadalb
At this point, ArcInfo identified the leadville projection horizontal distance (decimal degrees), datum (WGS84), projection (geographic), and parameters (standard parallel, longitudinal central meridian, latitude of projection origin, zero Xshift, and zero Yshift), and prompted the user to input the output parameters for the new leadalb file. The following text was then input:
output
This last step means that 96°W Longitude and 23°N Latitude became (0,0) meters in the projected Albers coordinate system.
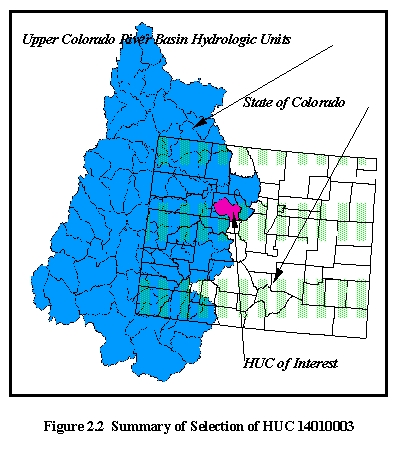
The next step in determining the aerial extent of the CAT III expansion was to identify the hydrologic unit which encompassed the Two Elk Creek watershed. Understanding that the United States is divided into successively smaller hydrologic units (which are classified into four levels: regions, sub-regions, accounting units, and cataloging units), and that the hydrologic units are arranged within each other, from the smallest (cataloging units) to the largest (regions), the Hydrologic Unit Code (HUC) that encompassed the Vail Valley was selected. Each hydrologic unit is identified by a unique hydrologic unit code (HUC) consisting of two to eight digits based on the four levels of classification in the hydrologic unit system
From the EPA Surf Your Watershed web site (http://www.epa.gov/surf/), the watershed was located using the map function and knowing the location of the Vail Valley in Colorado (Figure 1.1). Once the HUC was identified (HUC 14010003), the next step was to download the image data source for this watershed, import it into ArcView, and make sure it was in the same projection as the Leadville DEM already in ArcView. Downloadable data was available at http://water.usgs.gov/lookup/getspatial?huc250k.
Region 14 – The Upper Colorado River Basin is the HUC
that includes HUC 14010003. A file labeled huc14_250k.e00.gz was downloaded and
unzipped, leaving a file with a .e00 extension. The Import 71 program, part of the
ESRI ArcView package, was then used to create an output file containing the shape file of
the Upper Colorado River Basin hydrologic units. From the MetaData file, it was evident
that the shapefile was already in the Albers projection, so no additional projection was
needed.
A query was then run to select HUC1401003 from the rest of the HUCs in the Upper Colorado River Basin. The Query Builder button was selected with the entire Upper Colorado HUC theme selected. In the query dialog box, the following text was entered:
The Theme / Convert to Shapefile command was then used and the new theme saved. It was noted that the outline of HUC1401003 matched very well with the DEM elevation data.
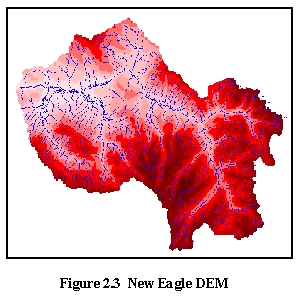
Figure 2.2 presents a summary of the process described above.In order to define the study area in the grid theme, a mask grid of the HUC14010003 shapefile was needed. A mask grid is used to extract any source grid for the extent of the study area - in this case the extent of HUC14010003. This was accomplished by making the HUC1401003 shape file active and converting it to a grid coverage using the Theme / Convert to Grid command. The Map Calculator command was then used to create a new DEM grid with its limits the same as the extent of the HUC14010003 shapefile (Figure 2.3).
This step involved using the ArcView Spatial Analyst extension and the CRWR-PrePro tools to process the new Eagle DEM and delineate the Two Elk Creek watershed and stream network.
The Analysis/Properties command was used to set the Analysis Extent and Analysis Cell Size to Same as eagdem to ensure that the grids generated were spatially consistent with each other and contained cells of the same size.In order to use the CRWR-PrePro tools, EPA's river reach files were necessary to specify the location of water bearing units within the limits of the grid coverage of interest. River reach files are a series of hydrographic databases of the surface waters of the continental United States; the attributes of which (including flow direction) provide connectivity regardless of the presence or absence of topologic continuity in the digital linework. These attributes determine what is upstream and what is downstream of a given point in the stream network. River Reach Version 3 (extension .rf3) files were downloaded in self-extracting format from http://www.epa.gov/OST/BASINS/HUCS/14010003/. The river reach shapefile for HUC 14010003 was added to the project and converted to the Albers projection from the geographic projection and matched very well with the contours of the DEM.
The CRWR-PrePro tools were then utilized to delineate the sub-watersheds contained in HUC14010003. The following steps provide a summary of the procedures used to run the PrePro tools and comments particular to this application. For a more detailed discussion, the reader is referred to Dr. Maidment's CE394 K-3 Fall 1998 Virtual Class web site.
Since the computer was unable to vectorize the streams and watersheds at this point (becauseof the number of stream segments and sub-watersheds) additional steps were taken to process the data:
Figure 2.5 presents a view of the final Two Elk Creek watershed after the stream segments and sub-watersheds were merged. The vectorized streams match the river reach file data very well, except in the top left corner of the figure (resolution of this and other images was lost when converting this document to HTML format). Upon further review, although the river reach data does not depict a stream in this location, other topographic maps provided in the EIS do show a stream in this location, so the vectorized streams were considered accurate.
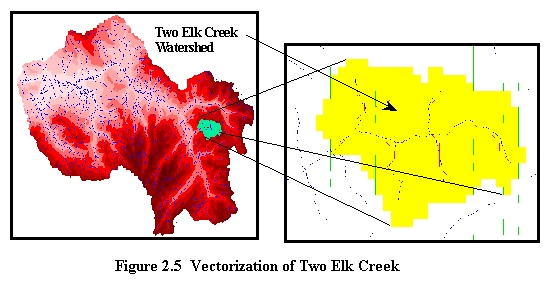
From the attribute table generated from the Two Elk Creek watershed polygon, it is evident that the area of this watershed is approximately 7,065 acres. When compared to the acreage of the entire hydrologic unit (622,839 acres), the Two Elk Creek watershed only makes up 1.1% of the entire HUC.
Annual runoff is an excellent indicator parameter that can be used to determine the impacts on the quantity and quality of water generated as a result of the development of the CAT III area. Although flooding is not a great concern in this area, (due to the size of the watershed and the lack of human population or infrastructure), runoff can lead to erosion of the soil surface, which will impact vegetation and water quality in the receiving streams. In addition, these impacts also affect wildlife and fish in the area.
Calculation of annual runoff by any method requires that the annual precipitation for the area of interest be known. In ArcView, this information should be available in grid format so that calculations with spatial data can be completed. The data selected for this project was obtained from the Oregon Climate Service at Oregon State University at http://www.ocs.orst.edu/prism/state_products/co_maps.html.
This historical mean annual precipitation data was generated by the Parameter-elevation Regressions on Independent Slopes Model (PRISM) model from over 8000 National Weather Service Cooperative (NWS COOP) stations, NRCS Snowpack Telemetry (SNOTEL) stations, and local networks ranging in time from 1961 through 1990. A station was included in this model only if had at least 20 years of valid data. Annual maps were compiled by totaling average monthly precipitation. The PRISM model is designed specifically for regions with mountainous terrain, because it incorporates a conceptual framework that addresses the spatial scale and pattern of orographic precipitation. This data can then be combined with DEM elevation data to generate gridded estimates of annual precipitation.
The PRISM data set was downloaded for
Colorado and projected as a feature data source using the Albers projection. The feature
data source was then clipped to cover only the coverage of HUC 14010003. The data
consisted of vector and polygon coverages (precipitation contours) (Figure 3.1), so it
required a conversion to grid format to be usable in the annual runoff calculations. An
ArcView script written by Andrew Romanek of
the CRWR (interpol.ave) interpolates between the known precipitation of each
polygon to generate precipitation values in each cell of a grid coverage that matches the
grid coverage of the watershed of interest. 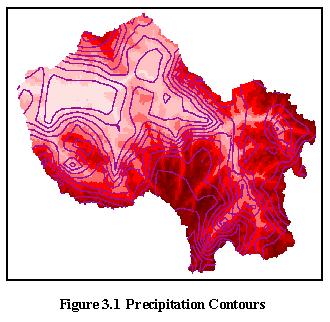
The script was downloaded from Andrew's
web site and loaded as a script in ArcView. It was then compiled and added as a button in
the title bar while in the View window. This step is critical because the View
window must be active in order for this script to be executed properly. From this point
grid coverage of the annual precipitation falling over HUC14010003 was generated, and then
a mask grid was created to generate the grid coverage of the precipitation falling over
the Two Elk Creek watershed (Figure 3.2). The differences in the color between the HUC
1401003 grid and the Two Elk Creek watershed grid is due to different precipitation scales
between the two grids. The mean annual precipitation falling on the Two Elk Creek
watershed was determined to be 27.69 inches. 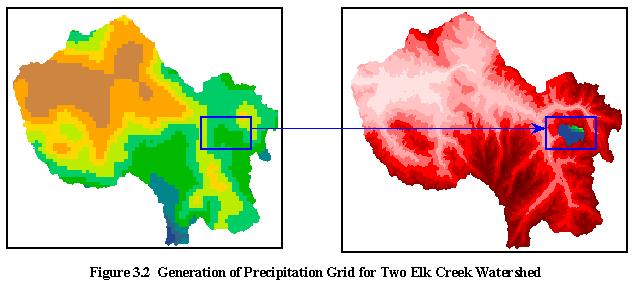 back to top
Land Use and Land Cover (LULC) and soils data for the Two Elk Creek watershed was necessary because the annual runoff was calculated using the Natural Resources Conservation Service (NRCS) method. The purpose of this data is ultimately to create a curve number grid over the entire Two Elk Creek watershed that relates the amount of runoff to a given amount of rainfall.
LULC data was downloaded from the EPA ftp site ftp://ftp.epa.gov/pub/EPAGIRAS/mgiras/. Downloading this data was difficult and took many iterations before it could be effectively imported into ArcView. The selected file for the Leadville DEM coverage presented in Section 2.1 was named LLE39106. This file is distributed by EPA in exported format, and needed to be imported into ArcInfo format prior to use. The following steps were implemented in ArcInfo:
Once this step was accomplished, the polygon coverage was added as a theme to ArcView (already projected using the Albers method). Figure 3.3 presents the coverage of the LULC. An attribute table was also created in ArcView that presented the data associated with the LULC coverage. This data consisted of:
The LULC file used the Anderson Land Use Code classification system, in which land use categories are broken into 9 categories:
- Urban
- Agriculture
- Rangeland
- Forest
- Water
- Wetlands
- Barren Land
- Tundra
- Ice and snow
This land use classification was created in the 1970's, but is still the standard land use classification in the United States. It is the same classification scheme implemented in the EIS.
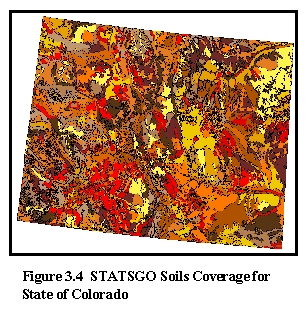
Soil data was also necessary to calculate annual runoff for the Two Elk Creek watershed using the NRCS method. This data was downloaded from the State Soil Geographic (STASGO) database from http://www.ftw.nrcs.usda.gov/statsgo2_ftp.html. The data set is a digital general soil association map developed by the National Cooperative Soil Survey and consists of a broad based inventory of soils and nonsoil areas that occur in a repeatable pattern on the landscape. The STATSGO soil maps are compiled by generalizing more detailed soil survey maps. The soil map units are linked to attributes in the Map Unit Interpretations Record relational database, which gives the proportional extent of the component soils and their properties in each map unit.
STATGSO was designed primarily for
regional, multi-county, river basin, state, and multi-state resource planning and, as
such, the large size of the polygons make it suitable only for large areas. Another
database, called SSURGO (still under development by the USDA), details soil polygons on
the component level as opposed to the map unit level and would be more suitable to small
coverages like the Two Elk Creek watershed. The STATSGO soil data was downloaded from the
site above and added as a polygon theme to the ArcView project. No projection was
necessary (Figure 3.4). 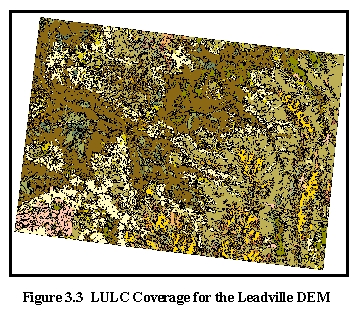
Attribute tables were also imported into ArcView that defined the data associated with each polygon. The mapunit.dbf table contained the Map Unit ID and the Map Unit name. The comp.dbf table contained descriptive data on each Soil Component, such as:
The hydrologic soil group for each soil component was the most important factor for calculating annual runoff and will be described further in Section 4.
![]() The NRCS (formerly SCS) Method has developed a widely used curve number
procedure for estimating runoff, which embodies the effects of land use and treatment, and
thus infiltration. This method consists of selecting a precipitation event and
computing the direct runoff by the use of curves founded on field studies of the amount of
measured runoff from numerous soil cover combinations. In this application, the soil
and cover combinations are generated from tables associated with the STATSGO soil and LULC
data retrieved in the previous section and a curve number generated for each cell in the
grid of interest.
The NRCS (formerly SCS) Method has developed a widely used curve number
procedure for estimating runoff, which embodies the effects of land use and treatment, and
thus infiltration. This method consists of selecting a precipitation event and
computing the direct runoff by the use of curves founded on field studies of the amount of
measured runoff from numerous soil cover combinations. In this application, the soil
and cover combinations are generated from tables associated with the STATSGO soil and LULC
data retrieved in the previous section and a curve number generated for each cell in the
grid of interest.
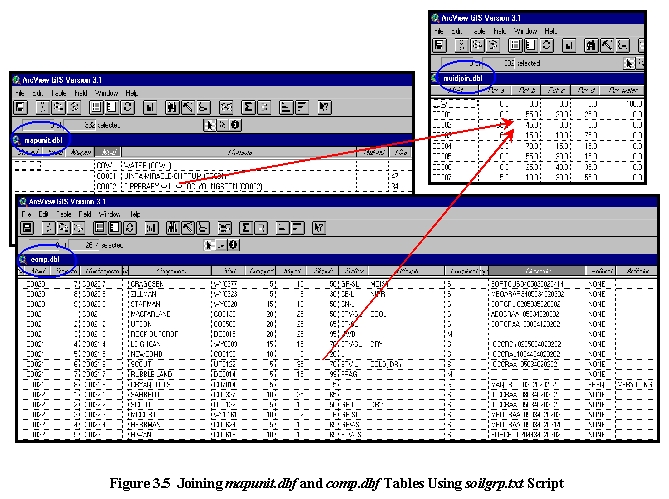
The first step in developing the curve number grid was joining the mapunit.dbf and comp.dbf tables to generate a table that presents the percentage of each hydrologic soil group in each map unit. A script was loaded, compiled, and run called soilgrp.txt that combined the two tables (Figure 3.5) into a new table called muidjoin.dbf.
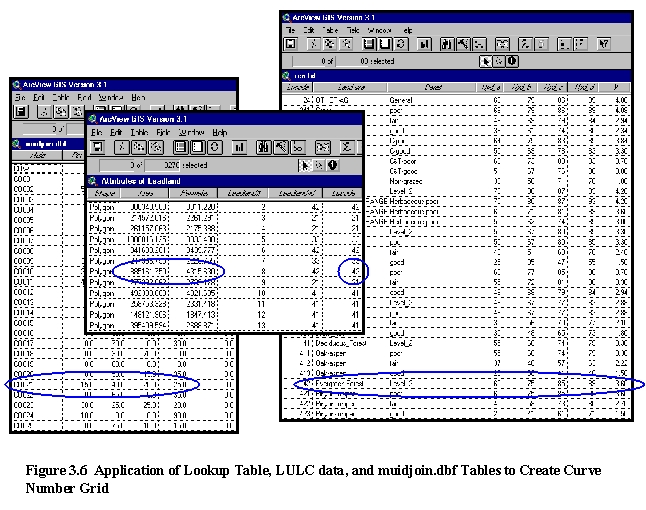
The cn.txt script was loaded
next, compiled, and run to generate the curve number grid for the Two Elk Creek watershed
coverage (Figure 3.6). This script utilizes attributes of the land use tables, the
percentage of the different types of soil in each map unit, and a "look-up"
table (rcn.txt) that selects the cell curve number based on land use, the
hydrologic condition of the soil, and the soil type. The Analysis/Analysis Extent
and the Analysis/Analysis Cell Size was specified as the shapefile of the Two Elk
Creek watershed.
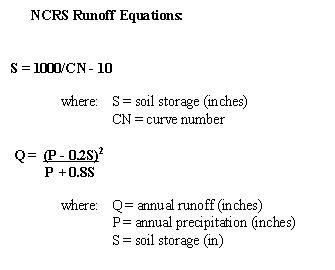
Now, with the curve number in each grid
cell calculated, the annual runoff grid for the Two Elk Creek watershed was determined
using the NRCS equations presented below.
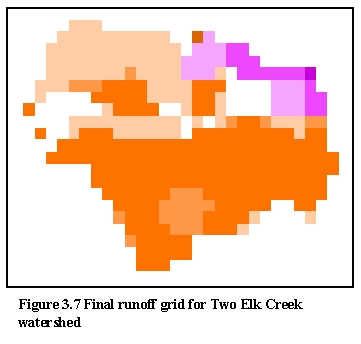
The total runoff for the Two Elk Creek
watershed was calculated by summing the annual runoff for each cell in the grid. Figure
3.7 presents the final runoff grid calculated for the Two Elk Creek watershed. The purple
coloring shows areas of the least amount of runoff, while the darker brown colors depict
the areas of more runoff.
The runoff grid calculated above was for existing conditions, with no development of the CAT III area. Annual runoff is expected to increase due to the effects of loss of
vegetation (timber) on the Two Elk Creek watershed based on the following water balance equation: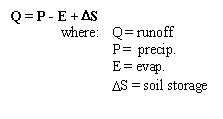
The most influential factors affecting runoff lfow volume are precipitation, infiltration rates, and surface storage (Veismann, Introduction to Hydrology, 1989). In this situation, loss of vegetation will increased runoff because:
However, due to the lack of quantitative data relating the above parameters to increased runoff, the runoff is also expected to increase based on the following facts:
For these reasons, the percentage of each hydrologic soil group (A, B, C, and D) in the study area was changed based on estimates of acreage disturbed during the development for the Proposed Alternative (as listed in the EIS).
As presented in the EIS, approximately 849 acres of ski runs will be added as a result of the development of the CAT III area. 441 of these acres will be gladed runs, while 408 acres will be graded runs. The EIS has assumed a soil disturbance factor of 12.5 percent for the gladed runs, meaning that of the total 441 acres, 53 acres will actually be changed significantly (i.e., timber will be logged). Similarly, for the graded runs, the soil disturbance factor was estimated at 90%, producing 369 acres of vegetation loss. So, 422 acres of the total 849 will lose vegetation.
The EIS has also assumed that there are a total of 5377 acres encompassing the new development in the Two Elk Creek watershed. As seen in the original muidjoin.dbf table, 15% of the development will be on soil group A, 40% on soil group B, 20% on soil group C, and 25% on soil group D. Assuming that all of the ski run development (422 acres) will change the soil group from A to D, the new percentages for soil group A is 7.2%, and soil group D is 32.8%. It is assumed that there will be no change to soil groups B and C.
The new values, show in the muidjoin1.dbf
table of Figure 3.8, were then added as a new table in ArcView, and the cn.txt script run
again. This produced a new runoff grid that depicted the effects of vegetation loss on the
watershed as a whole.  back to top
![]()
The results of the annual runoff calculations were compared to the values in the EIS for:
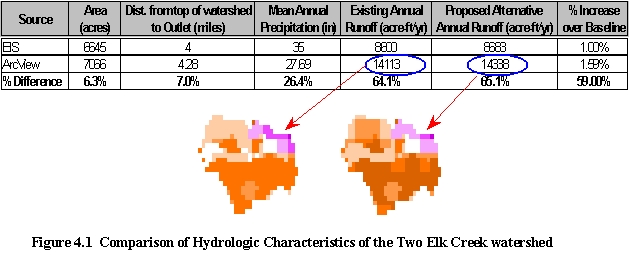
Figure 4.1 presents a comparison of some features of the Two Elk Creek watershed, as well as existing annual runoff and the annual runoff resulting from the Proposed Alternative development. Large discrepancies can be seen in the mean annual precipitation and existing annual runoff data presented in the EIS versus what was calculated in ArcView for this project. There are also differences in the spatial distribution of the runoff, as can be seen in the runoff grids for each scenario.
The conclusions that can be drawn from this study are quite evident from the figures presented in the text.
![]()
Daly, C., R.. Neilson, and D.L. Phillips. 1994. A statistical-topographic model for mapping climatological precipitation over mountainous terrain. Journal of Applied Meteorology 33: 140-158.
Daly, C., G.H. Taylor, and W.P. Gibson. 1997. The PRISM approach to mapping precipitation and temperature. In reprints: 10th Conference on Applied Climatology, Reno, NV, American Meterological Society, 10-12.
Maidment, David R. Handbook of Hydrology. New York: McGraw-Hill, 1992.
USDA (United States Department of Agriculture) - Forest Service, 1996. Final Environmental Imact Statement - Vail Category III Ski Area Development. White River National Forest Holy Cross Ranger District Rocky Mountain Region.
USDA - Natural Resources Conservation Service Web site: http://www.ftw.nrcs.usda.gov
US EPA Web site: http://www.epa.gov
USGS Web site: http://www.usgs.gov
Veismann, Warren Jr., G.L. Lewis, and J.W. Knapp. Introduction to
Hydrology, Third Edition. New York: HarperCollins, 1989.
back to top
![]()
Return to Dave's Home Page Return to Department Home Page To Class Home Page