This exercise is intended to instruct you on how to build a base map for a spatial database of your interest using the Blue Nile Basin as an example. This base map comprises watershed boundaries from a recently completed delineation of the Watersheds and Stream Networks of the World. The delineation was performed at the Earth Resources Observation Systems (EROS) Data Center using global 30 arcsecond resolution digital elevation models produced by the US Geological Survey. In addition, you will delineate the watersheds and streams around the base map using the Digital Elevation Model (DEM) data.
This exercise also provides the information and links to the basic data sets such as the Delineated Watershed and Stream Networks, and DEM data.
After finishing the exercise, you are expected to be able to build a simple spatial database of the area of your interest. The database will include delineated stream and watersheds coverages.
The exercise will be conducted on Arcview3. It can be executed on either a PC or an Unix workstation.
The datasets required for this exercise include
Internet students can download the necessary files.
Site: ftp.crwr.utexas.edu
Login: anonymous
Password: your e-mail address
Directory: /pub/outgoing/crwr/gishydro/africa/ex3t
File(s):
The system used in numbering the basins in the US Geological Survey Basins of the World coverage was developed by Otto Pfafstetter, a Brazilian engineer. It uses a basin numbering system with different levels of classification. The numbering system used for Africa contains five different levels with level 1 being the highest level (major river basin) and level 5 being the lowest level (minor river or stream). At each level, the 4 largest basin are identified and assigned Pfafstetter digits 2, 4, 6 and 8, in a clockwise direction. The five largest interbasins (areas between basins) are assigned Pfafstetter digits 1, 3, 5, 7 and 9, in a clockwise direction as before. Closed basins (those not draining to the sea) are assigned the number 0 (zero). Basins continue to be subdivided and numbered as before at levels 2 to 5. Interbasins continue to be divided into the 4 largest basins at levels 2 to 5 but instead of numbering the resulting basins in a clockwise direction, the basins are numbered from the most downstream basin to the most upstream. A basin at the lowest level (level 5) basin is described by a four digit Pfafstetter number which describes the drainage path of the basin. For example, a Pfafstetter number of 8673 indicates that the basin drains through basin number 8 at level 1, basin number 6 at level 2, interbasin number 7 at level 3 and interbasin number 3 at level 4. (Note: a level 5 basin, does not drain through another level 5 basin).
The arcs in the Stream Network coverage are classified using the same numbering convention. The net result it a stream network in which each arc has a Pfafstetter number that describes this drainage path. This numbering system is especially useful because a look at the numbers enables us to determine whether connectivity of the arcs. This can be illustrated by looking at the examples posed by Kristine Verdin who processed the coverages for Africa.
USGS 30"
Digital Elevation Models (DEM)
You will also find many useful links for obtaining hydrologic data from Internet from GISHydro97 CD-ROM, GISHydro97 Online and Dr. David Maidment's Homepage.
All of the data used in this exercise can be download from the Internet, however, preprocessing the data for the whole of Africa is very time consuming and requires a lot of computer memory. Therefore, the required data sets have been preprocessed and placed on a CD-ROM for ready access.
To start off, you will create your working directory.
For PC workstation users, make a subdirectory called ex3 in the C:\temp\ directory, also a subdirectory called gisdata under ex3 directory.
Start an Arcview3 application by clicking on the ArcView icon. When Arcview is first executed, a new Untitled Project window is opened. This window includes several icons marked Views, Tables, Charts, Layouts, and Scripts. This is the main Project window, which allows you to create new Views, Charts, etc., or to open existing ones that you have already created in that project.
Now, be sure that the View icon is highlighted in the Project
window and click on New for a new view. Drag the view window out
of the way and resize it if necessary. Add a new theme to the view by clicking
on the Add Theme button ![]() on
the top tool bar. Go to your CD drive, click the directory afrdata under
africa directory, highlight the coverages shown: afcity, afstream,
afborder and afbasin (hold the Shift key while selecting the second
coverage), then click on OK to add them to your View window.
They will each show up as a bar in the legend portion of the View
window with the name of the coverage shown on it. Those coverages are called
themes in Arcview. Drag themes (by clicking beside the theme symbol, holding
down the mouse and dragging the box that appears ) to arrange the order
of them so they will show in the order of afcity, afstream, afborder
and afbasin from the top to the bottom. The order is important, since
it indicates the actual order of the map layers. Following the order from
the bottom to the top, click on the raised box to the left of the theme
names to make a check mark and see the coverages displayed in the View
window. These coverages are quite large, so it will take a while for them
to be displayed. The national political boundaries afborder to help to
provide orientation when determining the area of the interest. Save your
work as proj1.apr in your ex3 directory.
on
the top tool bar. Go to your CD drive, click the directory afrdata under
africa directory, highlight the coverages shown: afcity, afstream,
afborder and afbasin (hold the Shift key while selecting the second
coverage), then click on OK to add them to your View window.
They will each show up as a bar in the legend portion of the View
window with the name of the coverage shown on it. Those coverages are called
themes in Arcview. Drag themes (by clicking beside the theme symbol, holding
down the mouse and dragging the box that appears ) to arrange the order
of them so they will show in the order of afcity, afstream, afborder
and afbasin from the top to the bottom. The order is important, since
it indicates the actual order of the map layers. Following the order from
the bottom to the top, click on the raised box to the left of the theme
names to make a check mark and see the coverages displayed in the View
window. These coverages are quite large, so it will take a while for them
to be displayed. The national political boundaries afborder to help to
provide orientation when determining the area of the interest. Save your
work as proj1.apr in your ex3 directory.
Note: Each new action may trigger the all the coverages to redraw. This will take a lot of time since the coverages are quite large. You might want to turn afcity and afborder off by clicking on the check mark and remove them.
It is important to know what is an active theme. When you click beside the theme symbol, there is a raise bar around the theme name, this theme is an active theme. Any action relation to theme such as Delete Themes, Zoom to Theme or Theme Properties etc. will be performed on this active theme, even though the theme may not be viewed, either because the theme is not on the top layer or the check mark is not turned on.
You can use![]() or
or![]() to
zoom in or zoom out from a portion of the View window . To zoom to the
extent of active themes, use the tool
to
zoom in or zoom out from a portion of the View window . To zoom to the
extent of active themes, use the tool ![]() in
the upper row of the tool bar. To zoom to the full map extent, use the
tool
in
the upper row of the tool bar. To zoom to the full map extent, use the
tool ![]() .
.
By clicking the Identify tool![]() in
the View tool bar and then clicking on a map feature in the View, you can
find out information about any feature in the active theme (a display of
its record in the data table). If you click on a feature and do not see
the correct record displayed, check to see if the theme you are interested
in is active.
in
the View tool bar and then clicking on a map feature in the View, you can
find out information about any feature in the active theme (a display of
its record in the data table). If you click on a feature and do not see
the correct record displayed, check to see if the theme you are interested
in is active.
Building a Base Map Using Delineated Streams and Watersheds
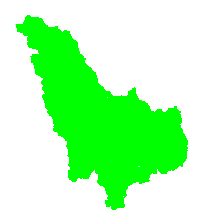
The afstream and afbasin coverages provided in the CD-ROM cover the whole of Africa but we only want to work in the one river basin, the Blue Nile. We will use Arcview to identify which watersheds (and later which streams) make up the Blue Nile Basin, and make a base map from the coverages provided. (The figure below is included for those who do not know what the Blue Nile basin looks like).
Lets begin by using the Pfafstetter coding system and the legend editor
to classify the watershed coverage, afbasin into level 1 basins.
Click on the Full Extent tool ![]() to
bring the view to the full extent, and keep the theme afbasin active
(the box around the legend afbasin is raised ) and displayed (the check
mark is on). Double click on afbasin in the View legend, and a legend
editor window like the one below appears.
to
bring the view to the full extent, and keep the theme afbasin active
(the box around the legend afbasin is raised ) and displayed (the check
mark is on). Double click on afbasin in the View legend, and a legend
editor window like the one below appears.
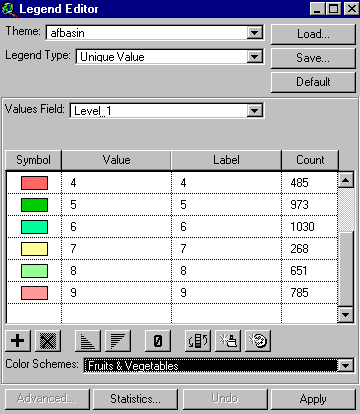
Set the "Legend Type" to Unique Value and the "Values Field" to Level_1. Choose a "Color Scheme" that allows you to have different colors for each value such as the fruits and vegetables scheme used here. You may also define your own color scheme by clicking on the symbol next to each value and selecting a color from the list presented. This results in a classification of the watersheds into 4 basin (the Nile, the Zambesi, Congo and the Niger), 5 interbasins and closed basins (Lake Chad) as we saw at the beginning of the exercise.
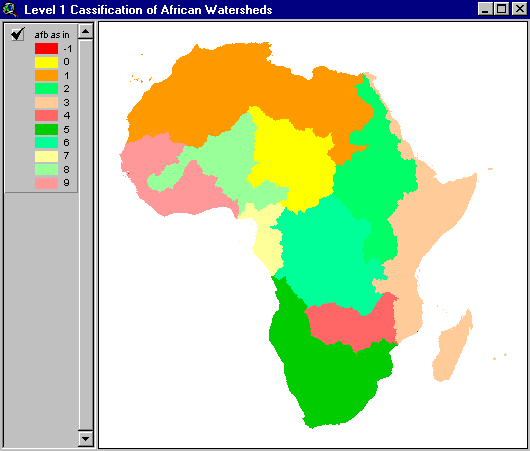
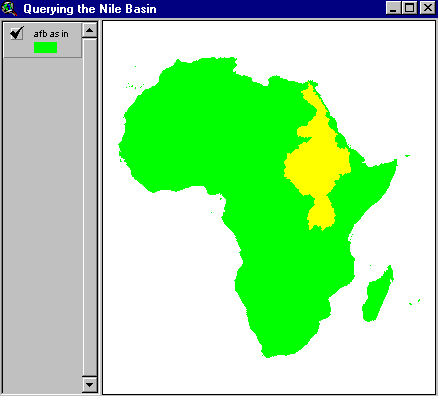
By comparing the colors in the legend with those in the View, you can
see that the Nile Basin have a level 1 Pfafstetter digit of 2. If it difficult
to tell from the colors, click on the identify tool ![]() in
the View Tool bar followed by a click in the Nile basin, in the View. Scroll
down to find the value in the "level_1" field of the resulting
information box. You now want to separate the Nile Basin from the rest
of the watershed coverage.
in
the View Tool bar followed by a click in the Nile basin, in the View. Scroll
down to find the value in the "level_1" field of the resulting
information box. You now want to separate the Nile Basin from the rest
of the watershed coverage.
Click on the Query Builder tool ![]() ,
a Query Builder window appears. Under "Fields", scroll
down to [level_1] and double-click on it. Then click on the "="
sign. Finally, under "Values", scroll to "2" and double-click
on it. You will notice that your sequence has been recorded (in parentheses)
in Query Builder's scratch pad.
,
a Query Builder window appears. Under "Fields", scroll
down to [level_1] and double-click on it. Then click on the "="
sign. Finally, under "Values", scroll to "2" and double-click
on it. You will notice that your sequence has been recorded (in parentheses)
in Query Builder's scratch pad.
Select New Set in Query Builder window, you will see a
blue bar appeared at the bottom of the view. After it disappears, close
the Query Builder window, and go back to Arcview. You can see the
watersheds in the Nile Basin are now highlighted in the View. Zoom in to
the Nile Basin by clicking on zoom in tool ![]() and
then draw a box around the selected watersheds.. The view will look like
following:
and
then draw a box around the selected watersheds.. The view will look like
following:
Create a new coverage containing only the selected watersheds by choosing Theme/Convert to Shapefile. When prompted, save the new coverage to your workspace with the name Nile.shp. Click yes when prompted on whether or not to add the coverage to the View as a new theme.
Selecting the Watershed of Interest.
This is a much smaller basin coverage but it still contains watersheds that make up both the White and the Blue Nile. You are now going to perform a level 2 query to isolate the Blue Nile. Double click on Nile.shp in the View legend. From the resulting legend editor, select "Legend Type" Unique Value and a "Color Scheme" fruits and vegetables as before. This time use Level_2 as the "Values Field". You can now see the Nile divided into its major subbasins. The Blue Nile basin which you want to isolate is labelled as subbasin number 24, where the digits 2 and 4 are the level 1 and 2 Pfafstetter digits, respectively.
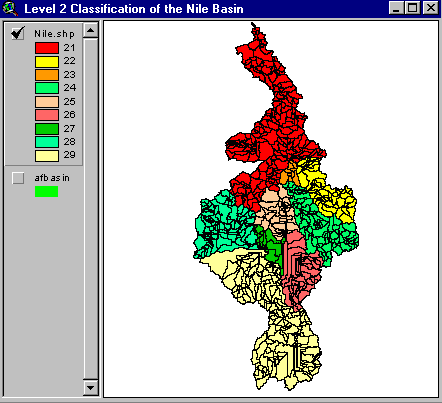
Notice that some of these subbasins do not coincide with the local definitions of the basins. For example, the area labelled as interbasin number 25 is usually understood to be a continuation of the White Nile from subbasin 21. These are some of the limitations of the methodology which may improve with further research and experimentation.
Click on the Query Builder tool ![]() and
scroll down to Level_2 under "Fields" and double-click on it.
Then click on the "=" sign. Finally, under "Values",
scroll to 24 and double-click on it. Select New Set, then close
the Query Builder window. Click on Zoom to Selected tool
and
scroll down to Level_2 under "Fields" and double-click on it.
Then click on the "=" sign. Finally, under "Values",
scroll to 24 and double-click on it. Select New Set, then close
the Query Builder window. Click on Zoom to Selected tool![]() and
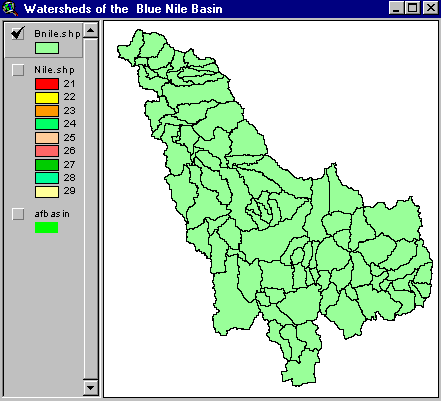
you can see the Blue Nile basin highlighted in the View. Extract the selected
basin to a new coverage using Theme/Convert to Shapefile... from
the View Menu bar. Call the new coverage Bnile.shp and add it to
the View as a theme.
and
you can see the Blue Nile basin highlighted in the View. Extract the selected
basin to a new coverage using Theme/Convert to Shapefile... from
the View Menu bar. Call the new coverage Bnile.shp and add it to
the View as a theme.
Extracting the Stream Network of the Blue Nile
You can also retrieve the arcs that make up the Blue Nile using the same procedure you used for extracting the watersheds. Use the legend editor to perform a level 1 classification of the stream network by double clicking on afstream in the View legend. Use Unique Value for the Legend Type, and level1 for the Values Field. This time, use a color scheme such as Minerals to highlight the streams that make up the various river systems.
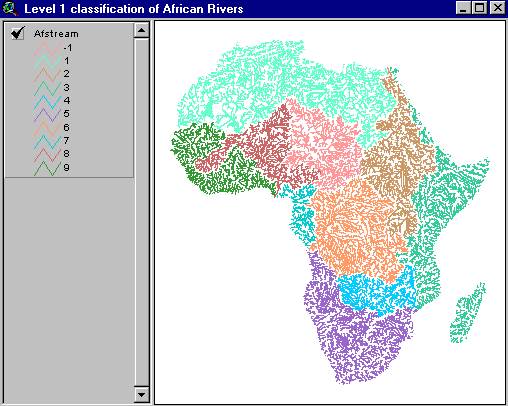
Notice that the Nile river system has a Pfafstetter level 1 digit of 2. This is the same as the digit for Nile basin subwatersheds. Since we know that the Blue Nile basin has a Pfafstetter code of 24, we can perform a level 2 query to isolate the Blue Nile stream network system, without first isolating the whole of the Nile system as we did before.
Build a query by click on ![]() .
In Query Builder window, double-click on "level2",
and "=", then type in 24, click on New Set.
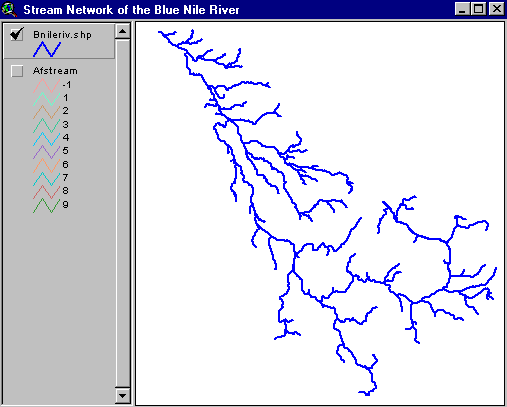
The arcs that located in the Blue Nile are selected and highlighted. You
can create a new coverage containing only the Blue Nile stream network
using Theme/Convert to Shapefile. Save it in your workspace under
the name Bnileriv. and add the shapefile to the View as a theme.
Save your work by clicking on File/Save.
.
In Query Builder window, double-click on "level2",
and "=", then type in 24, click on New Set.
The arcs that located in the Blue Nile are selected and highlighted. You
can create a new coverage containing only the Blue Nile stream network
using Theme/Convert to Shapefile. Save it in your workspace under
the name Bnileriv. and add the shapefile to the View as a theme.
Save your work by clicking on File/Save.
Save your work by clicking on File/Save.
Building a Base Map of the Blue Nile Basin
Now that you have the streams and watersheds that make up the Blue Nile, you can build a base map which shows the streams and their associated watersheds.
Turn off all the other themes except the new Bnile.shp and Bnileriv.shp
by turning off the check marks. You can label the watersheds in the basin
with their Pfafstetter codes by making Bnile.shp the active theme
and clicking Theme/Auto_label in the View menu. An Auto_lable
window appears. Make sure that the Label field is Grid_Code,
and turn off the "Allow Overlaping labels" check box, then Click
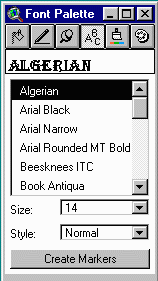
OK. The labels may be too large or have a weird font. You can change
this using Symbol Window. To do so, first select all of the labels
using Edit/Select All Graphics. Then choose Window/Show Symbol
Window, the Symbol Window will pops up. Choose the Font Palette
window and specify the font type, size and style you want. To change the
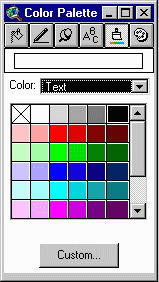
color of the text, click the paint blush icon ![]() to
invoke the Color Palette. Change the Color menu box from Foreground
to Text, then choose the color you prefer.
to
invoke the Color Palette. Change the Color menu box from Foreground
to Text, then choose the color you prefer.
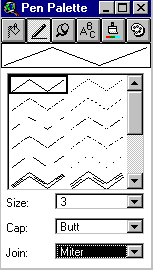
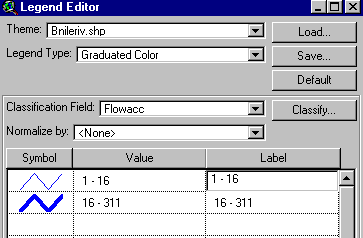
You may also want to differentiate between minor streams and the main Blue Nile River. You can do this using information stored in the flow accummulation field (Flowacc) of the Stream Network coverage. Double click on the Bnileriv.shp in the View legend to open the legend editor. Set the legend type to Graduated Color and the classification field to Flowacc. Click on the classify button and set type of classification to natural breaks with 2 classes. Return to the legend editor window by clicking OK. Click on the Value field and change the range of values for the two classes by typing in 1 - 16 and 16 - 311, respectively. Now, click on the Symbol field to change the colors and thicknesses of the river symbols to blue lines of 0.1 and 3 mm thickness for the respective range of fields, using the symbol palette.
The new legend will allow streams with a high flow accummulation (more cells draining through them) to be displayed with a a thick line while smaller streams are displayed with a thin line.
The base map should look like the following map:
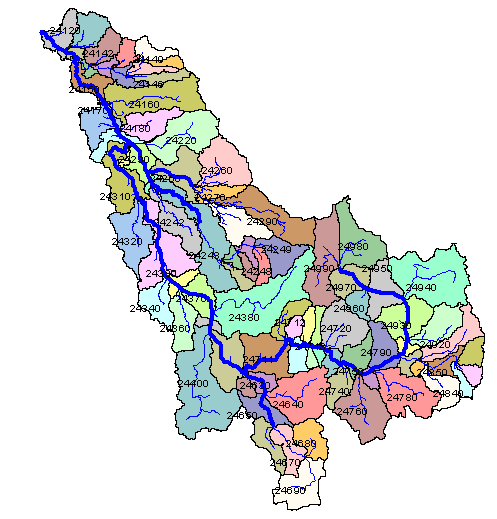
CONGRATULATIONS!
You have successfully developed the base map of the Blue Nile river basin.
Developing a Spatial Database of Interest
Now you've finished the whole exercise, you should be able to develop a base map, delineate the watershed and stream networks of the area of your interest.
Create a new workspace and try it!
When you're done with this part of the exercise, you'll need to clean up:
Simply delete the ex3 folder.
Ok! You're done!
Go to Dr. David Maidment's Home Page
09/16/1997