Exercise 7
Developing a Hydrologic Model of the Guadalupe Basin
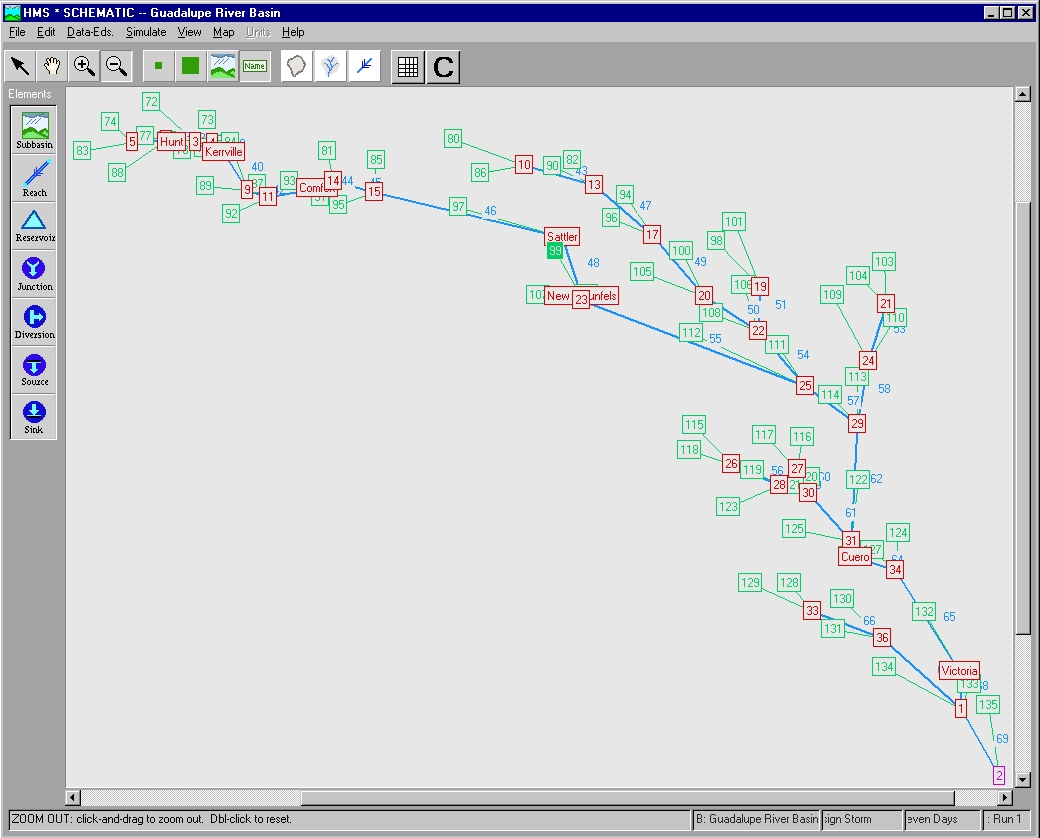
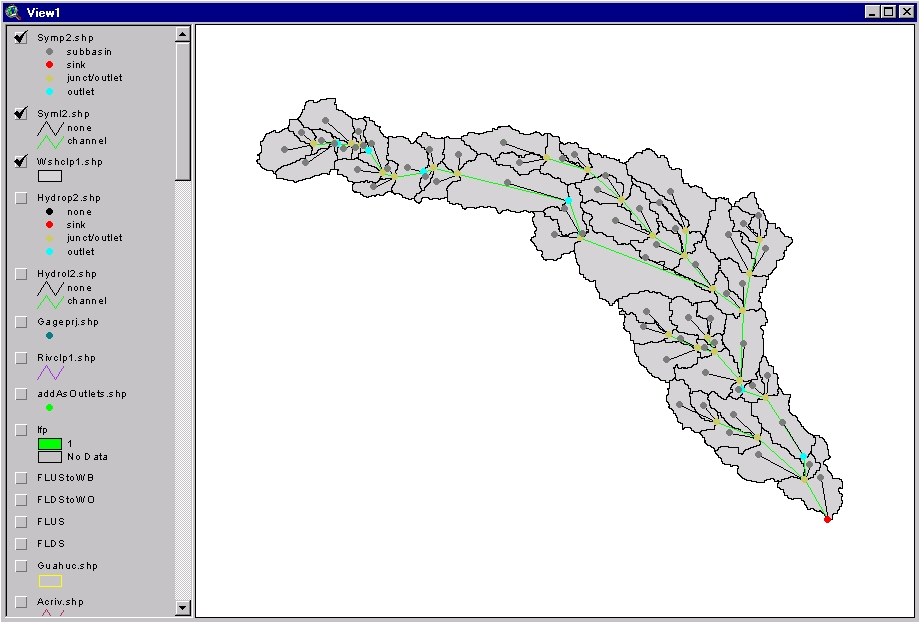
- Following pictures show the Guadalupe Basin schematic in ArcView and the corresponding schematic in HEC-HMS.
- Next table has the name of the seven gauging stations, the junction name assigned automatically by CRWR-PrePro to each one as well as the drainage area and the peak flow of each gage.
Name of the Station CRWR-PrePro Nr. Drainage Area (km2) Peak Flow (m3/s) Hunt 7 779.5 2209.6 Kerrville 8 1270.5 2916.8 Comfort 12 2221.25 2917.3 Sattler 16 3778 2838.3 New Bramfels 18 4032 2819.1 Cuero 32 12906.5 6286.6 Victoria 35 13608.75 6189.1 The values for the drainage area have been calculated multiplying the value of the flow accumulation in the corresponding gage (number of cells draining through that point) by the cell area (0.25 km2).
The peak flow values were calculated by HEC-HMS.
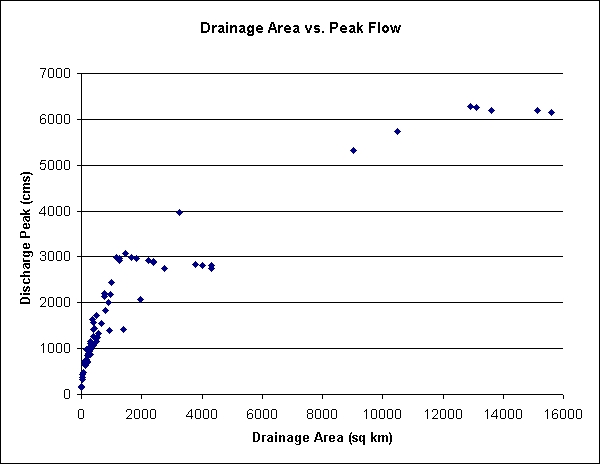
- The following chart relates the peak flow and the drainage area variables.
The points in the chart represent the values of the discharge peak calculated by HEC-HMS for 75 locations in the streams, each one with its corresponding discharge area.
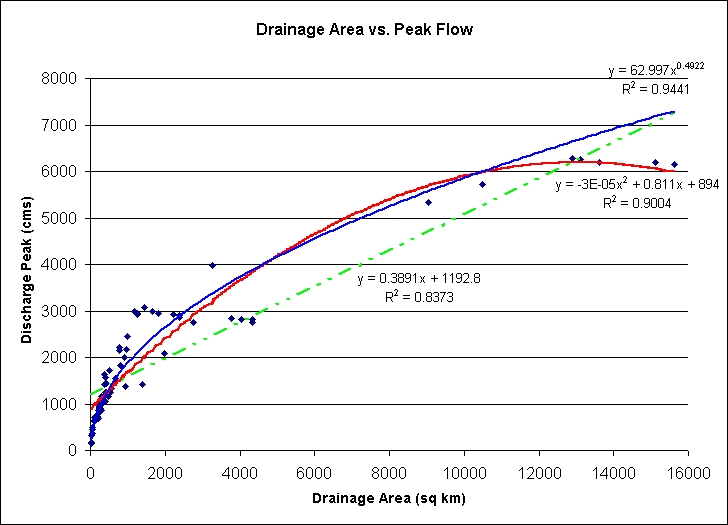
Lines in the next figure correspond to the different correlation calculated for those values. The best fit corresponds to the power trendline although the polynomial gives a better fit for the points located downstream the Guadalupe River (those with a bigger drainage area).
In general we can see there is a relation between the area and the discharge peak: the biggest the drainage area, the biggest the discharge peak we can expect.
- Finally, following figures show the hydrographs calculated by HEC-HMS for the New Braunfels gage and the Victoria gage respectively.
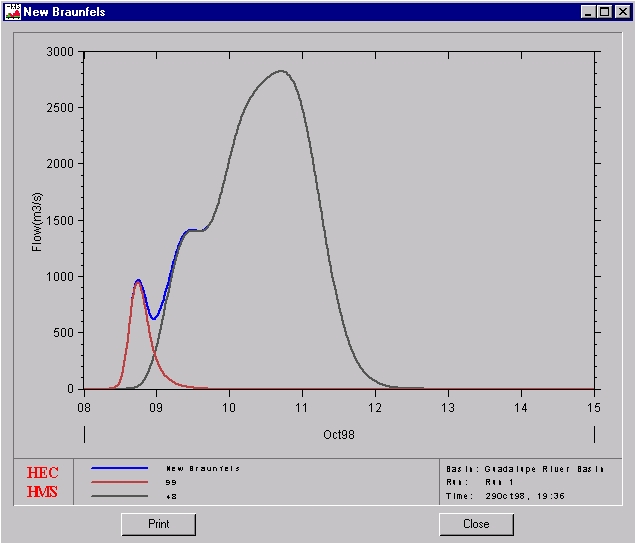
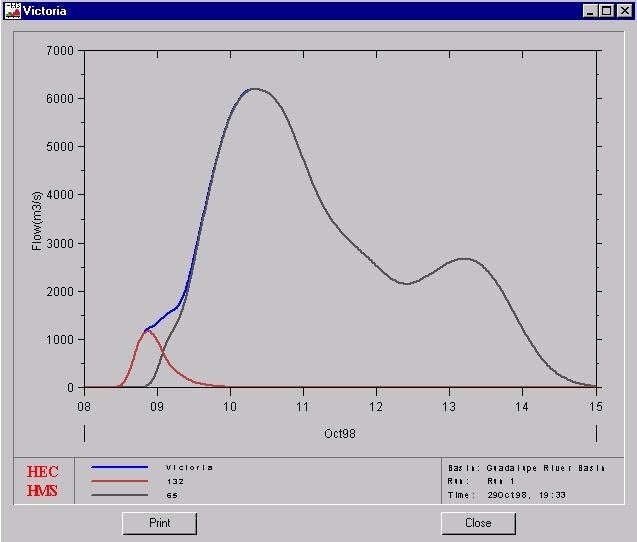
The red line represents the contribution of the subwatershed located right upstream of the outlet in each case. The black line is the contribution of the rest of the watershed (routed by the river). Finally, the blue line corresponds to the total hydrograph of the gage.
Prepared by Esteban Azagra
29 October 1998