Exercise 8
Mapping Environmental Data Stored in Microsoft Access ®
- Creating Queries in Access
We are identifying the location (LOC_ID, EASTING and NORTHING), the identification number of the sample (SAMP_ID), the concentration measured (VALUE), and the detection limit of the measurement (DET_LIM) of all the samples (CAS=71-43-2) taken from the soil matrix (MATRIX=SOIL) which have units of µg/kg (UNIT=UG/KG).
LOC_ID connects the tables Location and Sample_Collection while SAMP_ID connects Sample_Collection with Results.
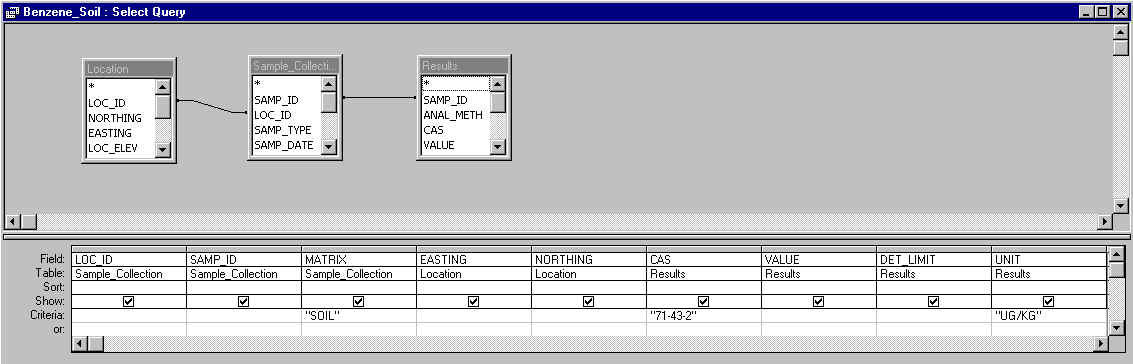
The fields used to select the required records are CAS, MATRIX and UNIT.
The query executed is called Benzene_Soil. It gives you the benzene samples taken from the soil in µg/kg.
The fields picked up as ancillary information about the selected records are LOC_ID, SAMP_ID, EASTING, NORTHING, VALUE and DET_LIMIT.
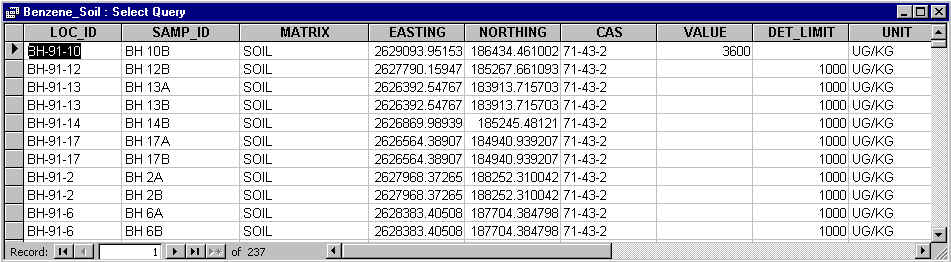
LOC_ID = BH-91-10. Identification number for the site at which the sample was collected.
SAMP_ID = BH 10B is the name given to the sample.
MATRIX = SOIL.
EASTING = 2629093.95153 is the Easting point in the map projection used.
NORTHING = 186434.461002 is the Northing point in the map projection used.
CAS = 71-43-2 is the code given to the chemical analyzed (benzene).
VALUE = 3600 is the concentration measured for the contaminant.
DET_LIMIT = " " is used to indicate the detection limit, minimum concentration detected by the analysis.
UNIT = UG/KG expresses the units of the concentration (µg/kg).
- Creating a New Point Coverage
The mean, median, range, maximum, and standard deviation of the measurements of benzene concentrations at the refinery are in the following table.
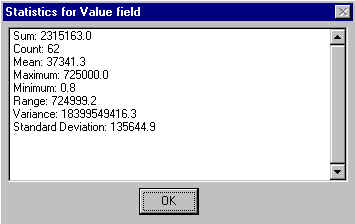
The median is 490.
The standard deviation of the values is very high, what indicates great variation of the concentration of contaminant whose values go from 0.8 to 725,000 µg/kg, with a mean value of 37,341 µg/kg. From 237 measurements, in 62 locations the concentration was below the detection limit (DET_LIMIT), which represents the minimum concentration that could be measured in the analysis. This shows the benzene is probably concentrated just in certain areas. The field VALUE holds the values of those 62 measurements.
- Inverse Distance Weighting (IDW) Method
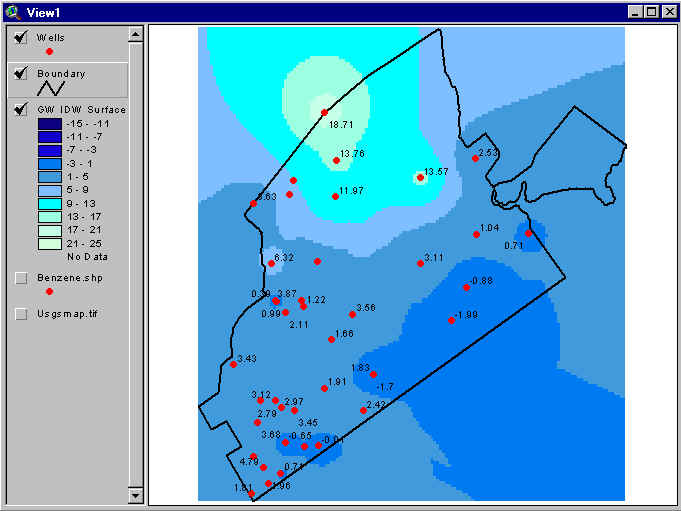
Following pictures show the location of the wells and the groundwater elevation corresponding to each one. The highest level is 18.71 feet.
The distance measured is approximately 3,450 feet across the property to the boundary line near the Delaware River. The difference of groundwater elevation between those points is around 19.31 feet, resulting from the difference of the 18.71 feet in the highest point and the -0.60 feet close to the boundary in the River side divided by the distance measured. Those values lead to a maximum gradient of groundwater flow of 0.0056.
- Spline Method
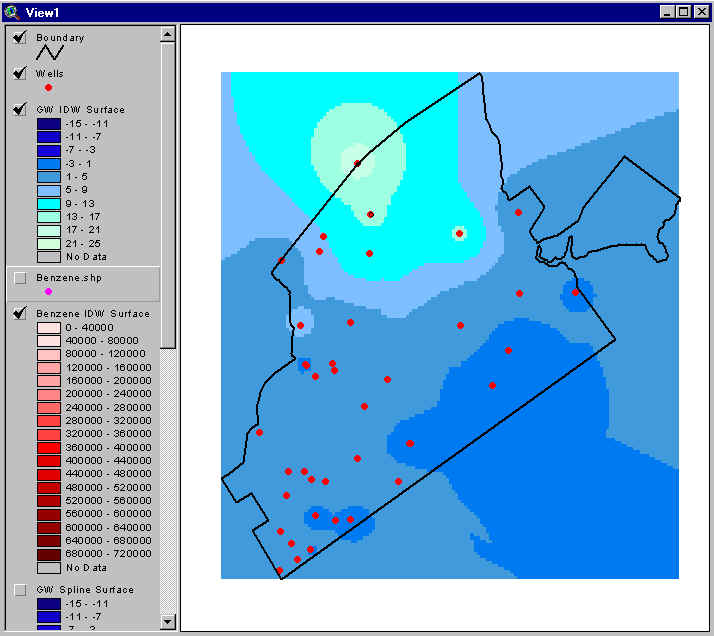
Depending on the mathematical models used for the calculation of the benzene concentration grids we can see some differences. The main difference is that while the IDW Method shows the Benzene concentration dispersed on the property of the Refinery, the Spline Method clearly shows the chemical flowing to the Delaware River.
The sample with the highest benzene concentration is the one with the identification number BH-5, with a concentration of 725,000 µg/kg.
The IDW Method is probably more accurate for the calculation of the groundwater measurements, since it gives values of the water level around zero close to the boundary with the Delaware River, and increasing values while you move far from the River into the land.
In the case of the benzene concentration, it also seems the IDW Method shows a behavior closer to the reality. With the Spline Method, we are obtaining concentrations of similar values for areas close to the points with highest values of benzene concentration than those for points located far in the Delaware River, showing a migration of chemical to the River.
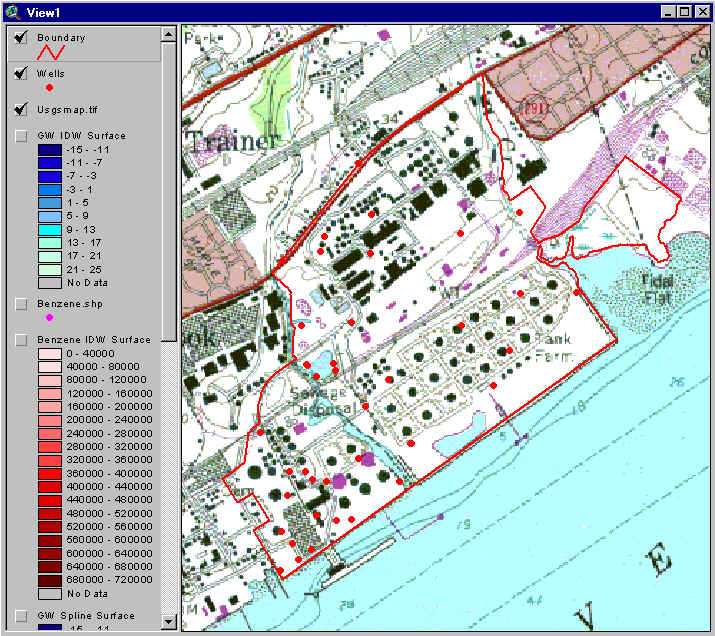
Following maps represent the groundwater elevation and benzene concentration calculated with the IDW Method.
- Using the Binomial Distribution
The best estimate probability of exceeding the considered threshold (15 µg/kg) for the source area data using the binomial distribution is 0.1277.
The upper bound calculated for the data is 25.74 %. The calculation has been done considering a confidence level of 95 % which means that there is only going to be a 2.5 % chance that the actual probability of violation will be greater than 25.74 %.
Prepared by Esteban Azagra
7 November 1998