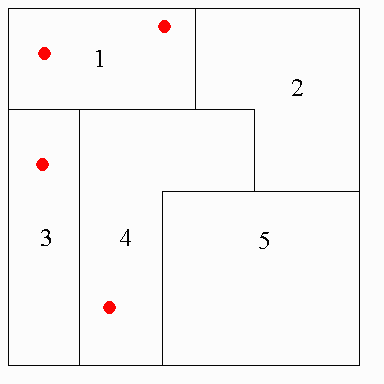
Figure 1: Polygons representing block groups, with TRI sites represented by red points.
Table 1: Example of Hazard Index values associated with the polygons in Figure 1.| Polygon Number | Hazard Index Value |
| 1 | 4 | 2 | 3 |
| 3 | 4 |
| 4 | 4 |
| 5 | 1 |
The goal of this project is to incorporate risk into a "Hazard Index" value, defined in a previous environmental justice study by the number of sites reporting releases for the Toxic Release Inventory (TRI) in an area and it's adjacent areas. The objective is to compare the results of a non-risk based approach to the results of one that incorporates a fundamental concept of risk assessment.
The project is based on work done previously examining environmental justice in Louisiana on a state-wide basis a parish, census tract, and census block group level. Due to time and resource constraints, this project narrows the scope to two parishes in Louisiana in the New Orleans area. The study is done on a census-block group level.
Toxic Release Inventory data is often used as a measure of exposure in environmental justice studies. In the case of the previous study, impact on communities surrounding TRI sites is assessed on the amount of chemicals released to the environment or the number of sites present, not accounting for the toxicity of chemicals that may be released.
This project seeks to form a comparison between an approach which incorporates toxicity and the approach used in the previous study, with the intention of determining incorporating toxicity affects the results of the previous environmental justice study.
With 35 sites in the two-parish study area, the large amount of data precludes a detailed risk assessment for each site. It is not the intention of this project to do a comprehensive risk assessment, but to incorporate risk concepts into an enviromental justice study.
Environmental justice, also sometimes referred to as environmental equity or environmental racism, has been a hot topic in recent times. It is defined as by the EPA's Office of Environmental Justice as:
Environmental justice first emerged as a topic of interest during the early 1980's, with the proposed siting of a PCB landfill in Warren County, North Carolina. Due to the interest in the case, the General Accounting Office (GAO) studied four landfills in the southeast region. It found that three of the four landfills were in predominantly African-American communities. The United Church of Christ conducted a later study, examining hazardous waste landfills and the racial and socioeconomic composition of the areas in which they were sited. The study concluded that while economics did affect the location of the landfills, race a more significant factor.
Since first emerging, environmental justice has generated a great deal of interest. In 1992, the EPA founded the Office of Environmental Justice and in 1994, President Clinton issued an executive order charging that each Federal agency should make environmental justice a part of its mission. Much of the impetus for environmental justice, however, comes from grass roots campaigns.
Recently, the EPA blocked state air permits when when Houston-based Shintech tried to site a PVC plant in the community of Convent, Louisiana. While this did not permanently block placement of the plant, it returned the permits to the Louisiana Department of Environmental Quality (LADEQ) for more work. Though it did not rule on the issue of environmental justice, a petition regarding environmental justice in the case is pending under the Civil Rights Acts.
Some interesting information on Environmental Justice:
The work in this project is an expansion of work done previously regarding environmental justice in Louisiana. The study in Louisiana was motivated by the 75% decrease in TRI chemicals between 1993 and 1994. The intention of the study was to determine if any racial or socio-economic group benefited more from the decrease in chemicals released.
One measure of exposure used in the previous study was a "Hazard Index" value, which was determined by the number of sites in an area and it's adjacent areas. The Hazard Index value for each of the five polygons seen below are:
Figure 1: Polygons representing block groups, with TRI sites represented by red points.
Table 1: Example of Hazard Index values associated with the polygons in Figure 1.| Polygon Number | Hazard Index Value |
| 1 | 4 | 2 | 3 |
| 3 | 4 |
| 4 | 4 |
| 5 | 1 |
The study concluded that all groups benefited equally from the decreased emissions of toxic chemicals, using TRI reports as an indication of emissions. This was based on pounds per year released in Louisiana, as well as the Hazard Index values. The study did not, However, account differing levels of toxicity of the chemicals released. Also, as the focus was whether communities were benefitting unequally from the change in emissions, the occurance of environmental justice issues for each year was not examined.
The data developed in the previous research was used for this term project. The data sets used to conduct the previous study include:
The data were processed in Arc/Info. A detailed description of the data processing is not included in this report, but can be seen upon request. The TRI data were overlaid on the parish, census tract, and block group data. Using Arc/Info, the location of each TRI site with respect parishes, census tracts and census block groups was determined. Census data was attributed appropriately for each area.
The concept of risk which is incorporated into this study is summarized by the following equation:
As previously mentioned, it is not the intention of this project to do a comprehensive risk assessment, as 35 sites and several chemicals would be involved. Calculations were not done regarding specific pathways for each chemical.
Exposure to the chemical was assumed to be directly related to the amount released. The toxicity of each chemical was used to determine relative risk, not to calculate risk based exposure limits. A comprehensive risk assessment would have required site data for each of the 35 sites involved and was beyond the scope of this project.
The first step in this study was to reduce the study area to the parishes of Orleans and Jefferson Parish, two parishes in the New Orleans metro area. The new study area is seen below.
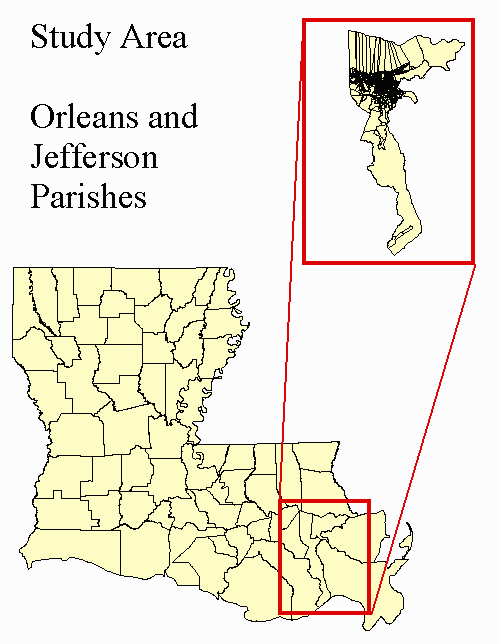
The study area consists of 1020 census block groups and 35 TRI sites.
Once the study area was defined, the data describing releases from the 35 TRI sites as selected from the overall data sets available from the previous study. The data needed was in three tables. Table 1 included data on chemicals released to water, Table 2 included data on releases to land (i.e. surface impoundments, landfills or land treatment), and Table 3 held data on both air releases (fugitive and stack) and releases through land injection (on-site deep well injections).
In these tables, values for the slope factor, reference dose, unit risk factor, and reference concentration were assigned for each chemical, as appropriate. It was assumed that releases to water, land, and land injection would follow an ingestion pathway, and thus releases to those media were associated with a slope factor and a reference dose. It was also assumed that releases to air would follow an inhalation pathway and so were associated with a unit risk factor and a reference concentration. Values for the slope factors, reference doses, unit risk factors, and reference concentrations were taken from then TNRCC documentation (Table VI, Toxicity Values).
The data was sorted by the toxicity values and each chemical assigned a scaling factor ranging from 1-5. Because higher reference doses or concentrations indicate a safe exposure to a larger amount of the chemical, a chemical with higher reference dose recieved a lower scaling factor. As higher slope factors indicate higher risk for smaller concentrations, chemicals with larger slope factors were assigned higher scaling factors. Values which had no data in the TNRCC tables were handled in two ways. The first method assumed that if no data was available in the TNRCC tables, a value of 0 was assigned. The second method assumed that if a chemical was not listed in the TNRCC tables, a value of 3 was assigned.
Once a scaling factor was assigned, it was multiplied by the amount released to yield a "weighted exposure". An example of the some values for releases to air are shown below.
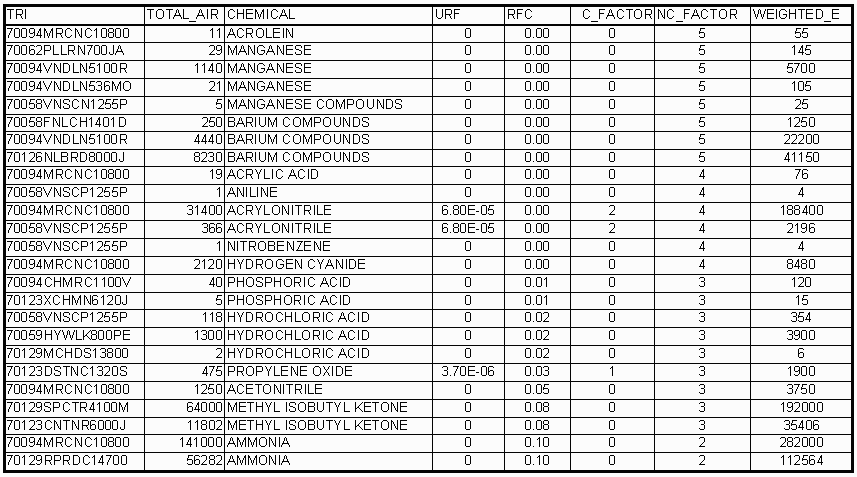
The weighted "exposure" due to each chemical was summed for each of the 35 TRI sites. From the values for each TRI site, a weighted "exposure" was determined for each block group. A total weighted "exposure" for each block group was determined by the weighted "exposure" of the block group and it's adjacent block groups. A updated Hazard Index value was calculated for each block group based on this total weighted "exposure". Because of the large range in values of the total weighted "exposure", the Hazard Index value was calculated as the log of the total weighted "exposure". Hazard Index values ranged from 2-8 using Method 1 and 2-9 using Method 2 for assigning scaling factors.
The Hazard Index values from the previous study ranged from 1-7. To compare these values with those using the Hazard Index values from the previous study, the values determined in this research were adjusted. For the values determined through Method 1, the Hazard Index became:
It was assumed, for Method 2, that a Hazard Index of 7 was sufficient to characterize areas with the highest risk. Also, the Hazard Index is used as a rough indicator of exposure, so the assumptions made for both methods are assumed to be reasonable for the purpose categorizing high exposure versus low exposure areas.
The values for the Hazard Index were used in conjunction with census bureau data to examine issues of environmental justice. The two data sets examined were median household income and total minority population (non-caucasian).
The following results and discussion relate to findings using Method 1, as described in the Procedure. A short comparison of the two methods will be made at the end of this section.
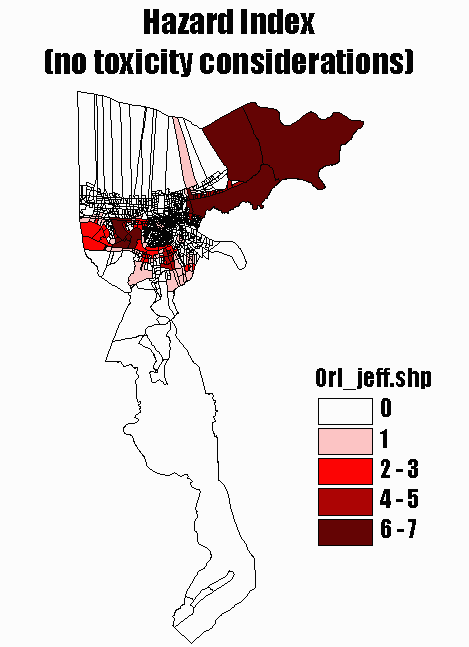
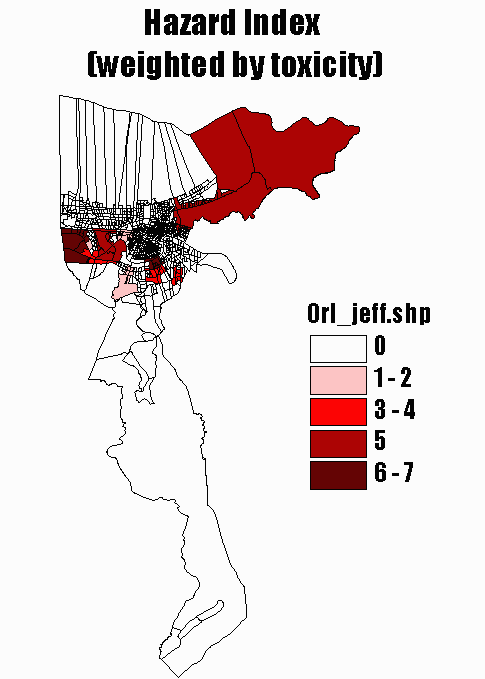
Differences in calculated Hazard Index values can be seen by comparing the following two figures. The most evident differences are changes between Hazard Index values of 5 and Hazard Index values of 6 or 7.
A general idea of the population and income distribution in the study area are seen in Figure 5 and Figure 6.
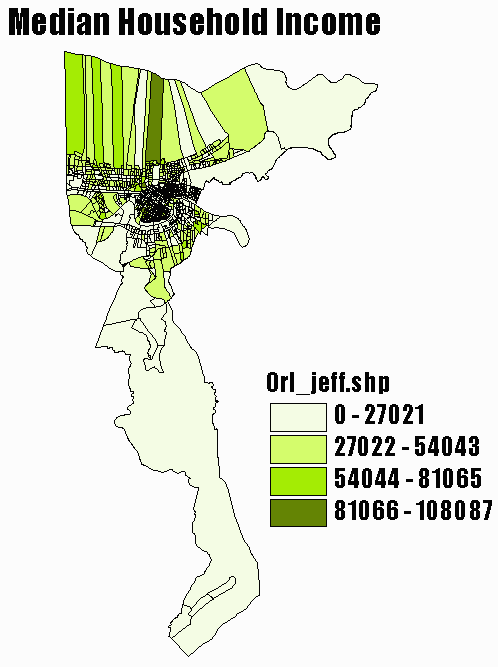
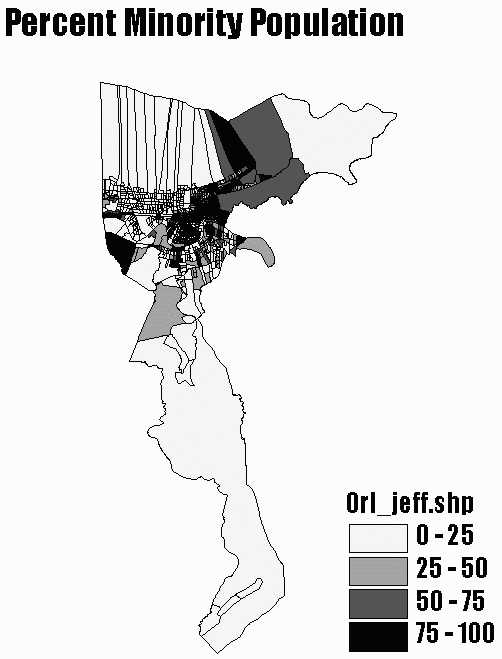
While Figures 3-6 help illustrate general trends, due to the small size blocks in the most heavily populated areas, a graphical approach is not the most effective in evaluating the data. Results in tabular format are discussed below.
Hazard Index versus Race
The following table summarizes the number of people who live in areas with the listed Hazard Index values. The values listed under "Weighted" indicate the values determined when incorporating risk concepts into the Hazard Index values. The values listed under "No Toxicity" were calculated through the method discussed from the previous study (number of sites).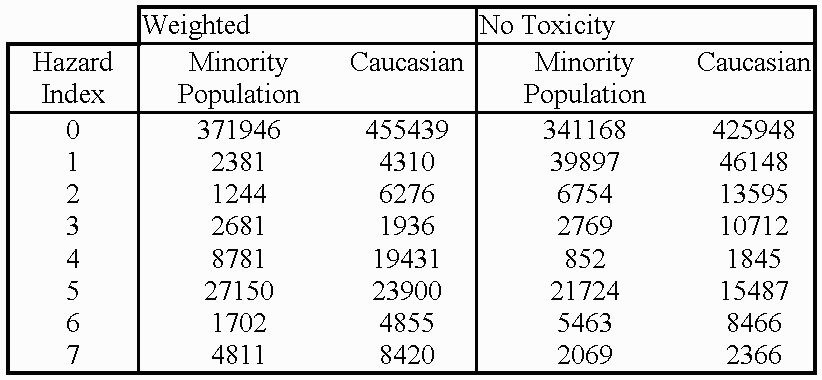
As indicated in the table, the large majority of both the minority and Caucasian populations live in areas with a Hazard Index of 0. The table also indicates that when incorporating toxicity into a Hazard Index calculation there is some significant redistribution of the Hazard Index in the population.
It is interesting to note that in both calculations, more Caucasians fall into areas with the highest Hazard Index values (HI = 6, HI = 7). Also, when incorporating toxicity values, the disparity in numbers becomes more apparent.
Another way to evaluate these numbers is to look at the cumulative population exposure, show in the following graph. The cumulative population exposure is the total number of people exposed to a hazard index less than the value along the x-axis.
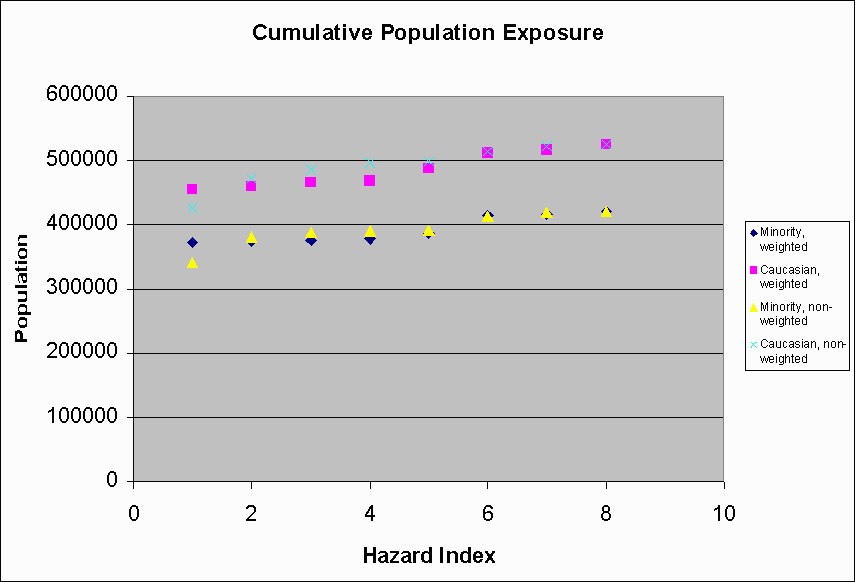
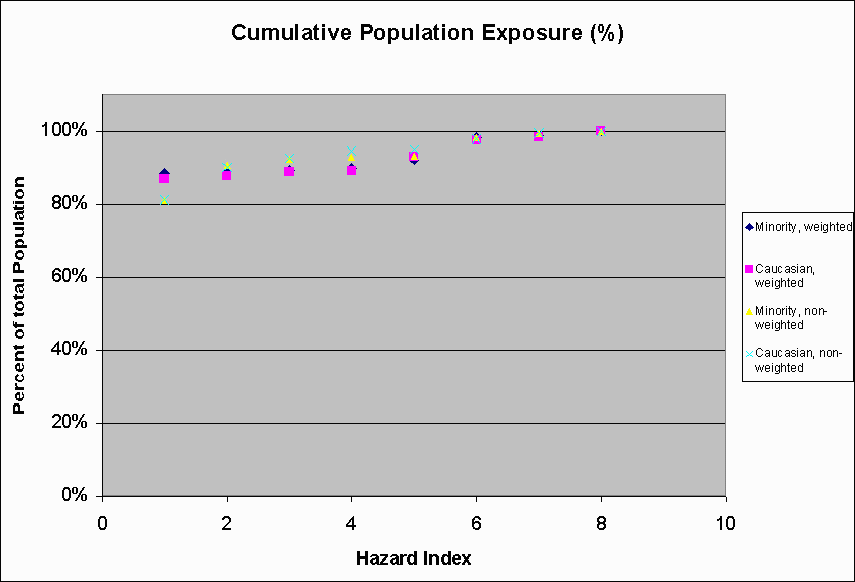
In Figure 8, the trends for Caucasian and minority groups is nearly identical. This indicates that both groups bear approximately equal enviromental burdens. However, the effects in this graph may be damped by the fact that the large majority of the population live in areas with a Hazard Index of 0.
Hazard Index versus Median Household Income
To examine median household income in relation to the hazard index, both the mean and median of the median household income are listed for areas associated with each Hazard Index value. Figure 9 shows the Median Household Income versus Hazard Index values calculated without incorporating toxicity values, while Figure 10 shows the values incorporating toxicity. The tabular values, also including minimum, maximum, and standard deviation values for each Hazard Index value are also available (Tabular data).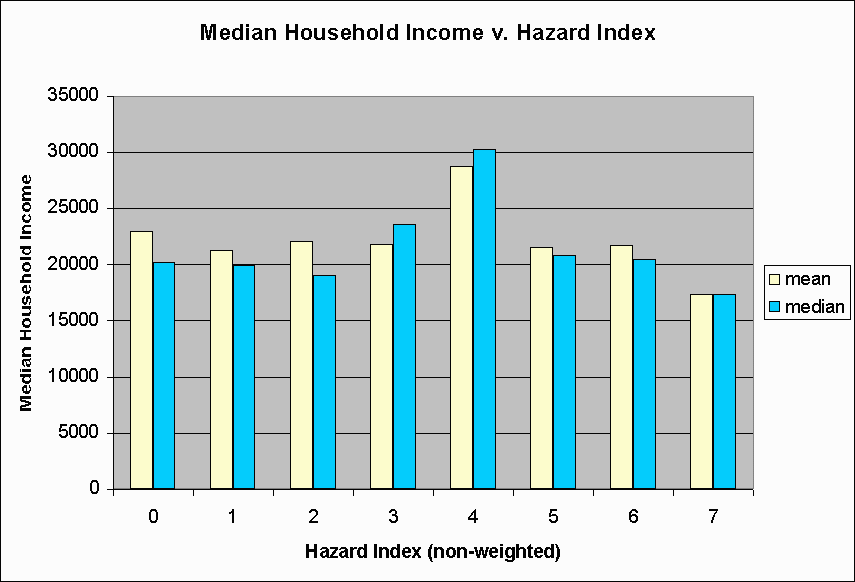
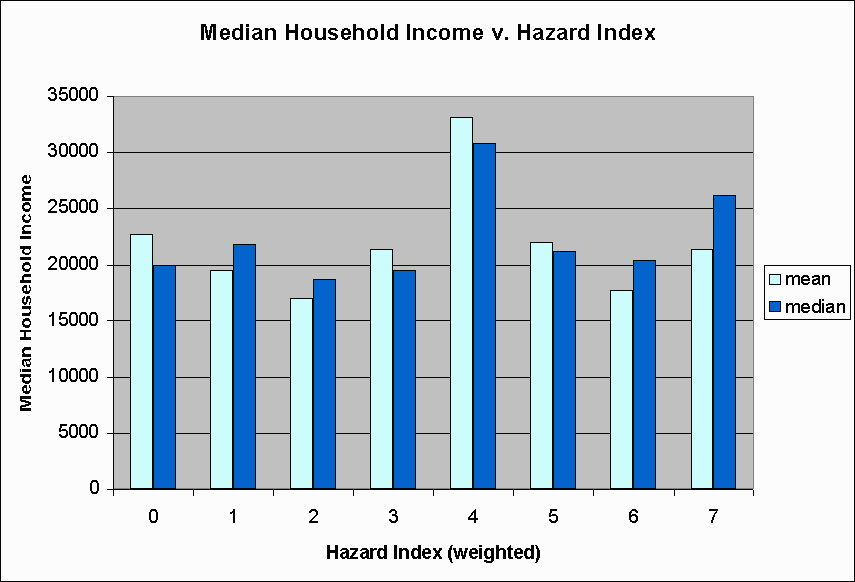 Figure 10: Median Household Income and Hazard Index values (weighted)
In both cases, the highest incomes are associated with a mid-range Hazard Index value (HI = 4). For the non-weighted HI value, the lowest mean and median incomes are associated with the highest Hazard Index. This, however, is not the case for the Hazard Index value incorporating toxicity, where the lowest income is associated with a Hazard Index value of 2. A claim of environmental justice seems more valid for the non-weighted Hazard Index value.
Comparison - Method 1 v. Method 2
The results discussed thus far in this report have been based on an assumption that when data was not available in the TNRCC Toxicity Values table, a value of 0 was assigned as a scaling factor. As discusssed in the Procedure section, the Hazard Index was also calculated using an alternative method where a scaling factor of 3 was assigned to chemicals with no listings in the table. While an evaluation of income and race versus the Hazard Index value calculated through Method 2 was not done, due to time constraints, Table 4 compares Hazard Index values of both Method 1 and Method 2 to those from the previous study.
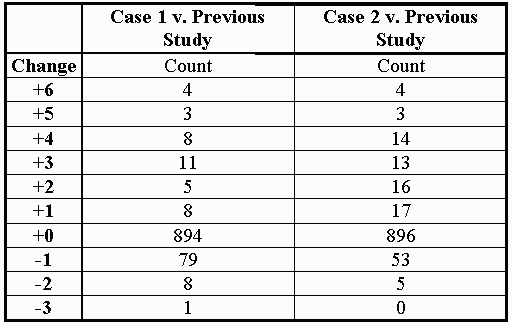
The "Change" value listed in Table 4 describes the change in the Hazard Index depending on the method of calculation used, with the "Count" indicating the number of block groups whose Hazard Index was affected by that amount (e.g. 4 block groups had an Hazard Index value 6 greater through Method 1 and Method 2 than when calculated in the previous study).
Table 4 indicates that more block groups experienced a decreased Hazard Index value for Method 1 calculations than for Method 2 calculations. The number of block groups unaffected by the choice of methods is approximately equal. As Method 2 would effect larger increases in Hazard Index values, it is likely that the results discussed above regarding income and racial composition would be affected by the method used in assigning scaling factors.
Comments on the Study Area
There are several aspects of the New Orleans area which might explain some of the results of this project. In an area where environmental justice is a very controversial topic, and one of high interest, one would nearly assume that the study would point to the unequal distribution of environmental burdens. However, New Orleans is an area with a high minority population. The study area has a minority population of nearly 45%. In addition to a high minority population, neighborhoods in New Orleans are mixed. Speaking from experience, it is often impossible to know what the neighborhood 3 streets away is like even if you're in the best parts of town. Perhaps the interspersing of neighborhoods of various incomes and racial compositions makes for more even distribution of environmental burdens as well.
This study attempted to incorporate concepts of risk into an environmental justice. There are several limitations to the work done which should, however be recognized.
Other comments
It can also be noted that intention has no mention in determining if environmental "discrimination" is occurring. When evaluating cases of environmental justice, it is only the eventual effects which are examined. Because intent is not an issue, and there are the additional complications of controversial facilities provided jobs, determination of environmental justice is not a simple matter. It has, perhaps, become a topic which is best dealt with through improved communication with the community involved. It is often a case of balancing protecting the human health and the environment and allowing economic growth.
Environmental justice is also a new enough concern that to a large extent it is still undefined. While the Shintech case was anticipated as a precedent setting case, the EPA did not disapprove of the permits on grounds of environmental justice, but on technical issues.