Estimating Daily Recharge from Infiltration and Evapotranspiration
Physical Hydrology, GEO 391/376S
December 4, 1998
Andrew Romanek
This project studies the development of a daily groundwater recharge rate using precipitation, temperature, and day length measurements. The project is applied to a 62-acre portion of an operating oil refinery in southeast Pennsylvania, and the results will be used in the larger scale environmental risk assessment research. The daily recharge rate is estimated as the difference between the daily infiltration and evapotranspiration rates. Infiltration is calculated using the Green & Ampt iteration methods and both daily and hourly precipitation measurements. Evapotranspiration is calculated using Hamon's potential evapotranspiration equation and a simple relationship between soil moisture and actual evapotranspiration. All of the climatic data required to run the model can be downloaded from the internet, but the soil parameters must be obtained from knowledge of the site-specific soil conditions. A Fortran code has been developed to calculate the daily recharge rates for a year's worth of data. There are a lot of assumptions incorporated in the model, including no spatial variability. However, the data required for input is relatively easy to obtain, and the model results could be useful for many applications, such as in comparing annual recharge variations and in developing sophisticated groundwater transport algorithms. This report includes the results from a simulation using 1997 measurements at the oil refinery. The results demonstrate the success of the model, but also point out potential flaws, such as in the moisture content changes. The model is probably more useful at sites with short intense storms because a large water input rate is required to force ponding.
The University of Texas at Austin (UT) and British Petroleum Exploration & Oil, Inc. (BP) are currently involved in a research project studying the use of Geographic Information System (GIS) technology as the basis for making risk-based decisions for site-wide corrective action. This research is being applied at a former BP oil refinery in Marcus Hook, Pennsylvania. The implementation of GIS software facilitates the attachment of tabular and spatial data, and it aids in evaluating source areas, transport mechanisms, and exposure pathways. The flexibility of GIS software also allows databases, maps, spreadsheets, and models to be analyzed with one framework. An extensive amount of work has already been spent building the databases and maps. The current phase of the project is to begin analyzing the data with map-based fate and transport models. Specifically, efforts have focussed on developing a surface water model and a groundwater model. The Groundwater Modeling System (GMS) program developed at BYU provides a graphical interface through which spatial data can be connected to MODFLOW, which is a 3-D finite element program that predicts groundwater flow movement. A map with delineated recharge areas, soil layer information, well information, etc. is constructed in GMS, and then GMS builds the grids and input files necessary to run MODFLOW. A steady state model has already been developed that uses a single groundwater recharge rate. The purpose of this project is to develop a transient approximation of the groundwater recharge that can be incorporated into the MODFLOW model. To accomplish this task, a daily recharge rate is estimated as the difference between the daily infiltration and evapotranspiration rates. A Green-and-Ampt approach is utilized to determine the infiltration based on daily storm events. Evapotranspiration is calculated using Hamon's potential evapotranspiration equation and a simple relationship between soil moisture content and the actual evapotranspiration. The data required for these calculations and the development of the model are discussed in the next two sections. The model has been applied to the former BP facility using 1997 climatic data, and the results of this application are discussed in the Results and Discussion section.
Many different ways exist to estimate recharge rates, including lysimeters, water balance methods, and numerical modeling methods. One of the primary reasons for the choice of the infiltration method used in this analysis was the ease in obtaining the data required for the model input. The data necessary for the infiltration and evapotranspiration calculations includes daily precipitation amounts, daily mean temperatures, daily sunlight measurements (i.e., day length), and hourly records for the daily storm events. The hourly data is needed so that an appropriate storm length for each day with precipitation can be incorporated into the Green & Ampt equations. All of these climatic parameters are available over the internet from the National Climatic Data Center (NCDC - http://www.ncdc.noaa.gov) and also from the National Oceanic and Atmospheric Administration (NOAA - http://www.noaa.gov). More specific references are available in the Appendix.
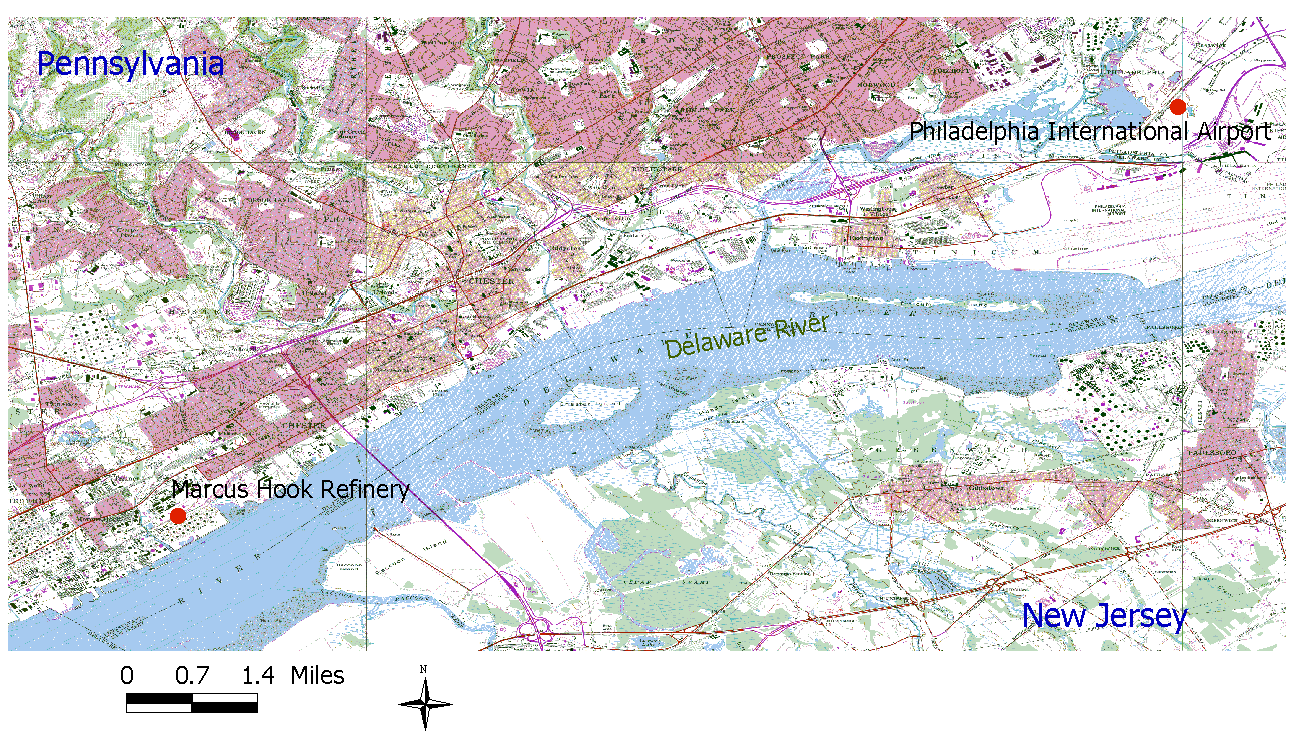
The former BP Marcus Hook refinery does not have its own weather station, but it is located about 9 miles from the Philadelphia International Airport as seen in Figure 1. The airport has had an operating weather station since 1940, and it is assumed that the data from this station provides the best approximation to actual weather conditions at the facility. More information about this station including ID numbers is attached in the Appendix. Extensive data sets of daily precipitation, temperature, and day length are available from both the NCDC and NOAA websites, but hourly records are only available since November 1996. The hourly values are important to the model because each infiltration calculation requires an individual storm duration. Therefore, this model will not be applicable for reconstruction studies, but it will be useful for any study after November of 1996 since this hourly data continues to be posted.
Figure 1: Proximity of weather station (USGS Topographic Map).
The infiltration calculations also require the following soil parameters: porosity (f), saturated hydraulic conductivity (Khsat), saturated pressure head (ys), pore-size distribution index (b), and initial moisture content (qo). These soil parameters can be estimated from existing knowledge of the soil conditions, from previous studies, or from sample analysis (e.g., using a permeameter to determine hydraulic conductivity). These parameters will vary both in space and time, but they are assumed to be constant in this model, except for the moisture content as discussed in the Model Formulation section. For the case study site in this project, the primary soil layers in the area of interest are bedrock (25-50 ft. below ground surface - bgs), sand and gravel (10-20 ft. bgs), clay (5-15 ft. bgs), and fill. Both the sand and gravel and fill layers support groundwater flow, but this analysis studies the recharge to the perched aquifer of the fill layer above the natural clay liner. At the time of this report, a consultant for BP was still working on obtaining the desired soil parameters. Thus, for purposes of illustration, the soil parameters used for the analysis were obtained from Table 6-1 of Dingman's Physical Hydrology. The values used in the analysis are those for the silty clay loam, which is assumed to provide the closest approximation to the actual soil type.
In order to simplify the calculations and develop a repetitive procedure, a Fortran program has been created to run the model. The program uses an input file with daily measurements of precipitation, mean temperature, day length, and storm length to compute the daily infiltration, evapotranspiration, and thus, recharge. Figures 2 and 3 show the decision framework used for the daily evapotranspiration and infiltration calculations, respectively. All of the model equations, variables, and assumptions are included in the Appendix. The Appendix also contains the actual Fortran code.
The actual evapotranspiration is calculated using a simple linear relationship between the potential evapotranspiration and the initial moisture content of the soil (i.e., the moisture content on the previous day). When the moisture content is above the field capacity for the specific soil type, the actual evapotranspiration is equal to the potential evapotranspiration. When the moisture content is below the permanent wilting point of the soil, the evapotranspiration is set to zero. For times when the moisture content lies between the field capacity and permanent wilting point, the actual evapotranspiration will equal the potential evapotranspiration multiplied by the fraction of saturation between the permanent wilting point and field capacity (see Figure 2). The potential evapotranspiration is calculated using Hamon's empirical formula (Dingman Eqn. 7-60). The values calculated by this formula are usually smaller than those calculated with other methods (Dingman 292). However, its minimal data requirements and ease of use are the primary reasons for its use in this project. Only measurements of daily mean temperature, day length, and initial moisture content are needed for the evapotranspiration calculations.
The model also includes four different infiltration scenarios (see Figure 3). If there is no precipitation on the day of record, then the infiltration will be zero. The recharge will also be zero on days with no precipitation. For days with precipitation, the infiltration rate depends on the time to ponding for the storm event. When the time to ponding is greater than the storm length, the infiltration rate is equal to the water input rate. When the time to ponding is less than the storm length, the infiltration is governed by the Green & Ampt relationships unless the soil is already saturated. In those instances, the infiltration rate is equal to either the saturated hydraulic conductivity or the water input rate, whichever is smaller. The hourly data obtained in the data acquisition phase is used to determine the individual storm lengths used in the Green & Ampt iterations. It is assumed that only one storm occurs per day, so the storm length is equal to the number of hours that it rained on the particular day. Setting the storm length equal to 24 hours could eliminate the use of hourly data, but this delineation would underestimate the importance of the water input rate in determining the time to ponding. It would probably also yield no situations with actual ponding. In fact, some initial model runs with the Marcus Hook data produced no days with ponding. A personal judgement of dividing the storm length by 3 led to better results, since this action minimizes the incorporation of the hours that show very small amounts of rainfall. For days when ponding does occur, an average infiltration rate is calculated from a series of values along the infiltration curve and the time frames associated with these values (see Appendix for equation).
In order to calculate both the daily evapotranspiration and infiltration, an initial moisture content is needed. This moisture content is computed as the previous moisture content plus the change in water storage (Infiltration - Evapotranspiration) divided by an average depth to groundwater. The average depth to groundwater comes from the relationship between the surface area of the site and the volume of soil. The depth for this project is estimated as 5 feet.
The input file required to run the model must be a tab-delimited text file containing four columns of data: daily precipitation [in], mean daily temperature [oC], day length [h], and storm length [h]. The current form of the model is set up to compute daily estimates for a year's worth of data, so the program will read the first 365 rows of data in the file. Setting up the input file is the only tedious task of the analysis process, and it requires cutting and pasting data from the downloaded climate files.

Figure 2: Daily evapotranspiration calculation framework.
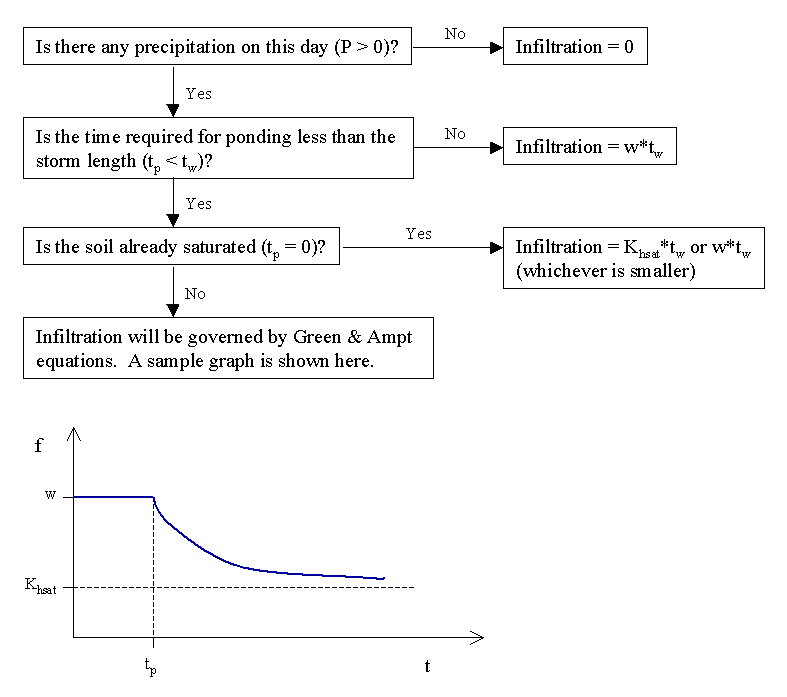
Figure 3: Daily infiltration calculation framework.
The Fortran code of the formulated model has been used to determine the daily recharge rates for 1997 at the former BP facility. Table 1 and Figure 4 show the calculated rates for April of 1997, and Figure 5 shows the moisture content change across the entire year. The results point out a number of interesting features about the model and some of the its shortcomings.
As evidenced in Table 1, the recharge rate is a strong function of the total precipitation. The evapotranspiration and diminishing infiltration capacity due to ponding play only minor roles in the recharge calculations. In most instances, the recharge rate is very similar to the total amount of precipitation on the particular day. This result seems reasonable, especially when considering the study area. Marcus Hook usually receives about 40 to 45 inches of rain a year, and this rainfall is fairly evenly distributed. Short and intense storms are somewhat of a rarity, so it is to be expected that there are only a few storm events in which the water input rate is greater than the saturated hydraulic conductivity. 1997, in particular, was a dry year in which only 32 inches of rain was recorded. Of this 32 inches, the model predicts 29 inches of recharge to the groundwater. These trends are also evidenced in Figure 4. The figure shows a close relationship between recharge, infiltration, and precipitaiton. It also shows that ponding, and thus reduced infiltration, are present on April 28.
The moisture content calculations also show a strong correlation with the precipitation measurements. A moisture content of 0.350, which is close to the field capacity, was assumed for the day prior to January 1 in the model run. As expected, the moisture content increases on days with precipitation and decreases due to evapotranspiration on days without precipitation. On days without either precipitation or evapotranspiration, the moisture content remains constant. Figure 5 shows that the increasing trends appear more dominant than the decreasing trends. The only significant decreases occur in the summer months when the temperature, and thus evapotranspiration, are higher. The moisture content remains above the field capacity after it initially crosses in January, and it reaches saturation twelve times. Due to the even distribution of rainfall and the limited evapotranspiration in the area, this result makes sense. Modeling soil moisture content is a difficult task because of the large variability in both space and time. The simple water storage relationship used in this model could be overpredicting the moisture content, and a more sophisticated model could incorporate an additional loss term due to vertical drainage. Actual soil moisture measurements could also be included as input to the model, especially with the increasing availability of remote sensing data.
As with any other model, there are a number of assumptions which have a bearing on the uncertainty of the results. These assumptions are listed in the Appendix, and a few of the key points are discussed here. Perhaps the most influential assumption on the results is the use of average and constant values for the model parameters. Most, if not all, of the parameters have an underlying distribution based on both spatial and temporal variations. Specifically, the relations among water content, hydraulic conductivity, and tension in the unsaturated zone above the water table have a significant impact on the recharge calculations (Dingman 334). Ignoring these variations could lead to unusable results. The other key assumption is that the recharge equals the difference between infiltration and evapotranspiration. There are a lot of complexities associated with vertical flow in the unsaturated zone, and all the water that infiltrates will not necessarily reach the groundwater. This model also assumes that the recharge is instantaneous (i.e., on the same day). Recharge is not instantaneous, but is instead delayed because of the slow movement of water through soil and because of the distance it must travel to the groundwater table.
The goal of this project was to develop a transient recharge rate through infiltration and evapotranspiration calculations, and this goal was successfully accomplished. Time constraints prevented testing the accuracy of the model, but future work could include comparing model results with actual field measurements of recharge and moisture content. An initial observation for improving the model would be to characterize transport in the unsaturated zone so that a better relationship is developed between what infiltrates and what actually becomes recharge. This transport would incorporate the time lag between a storm event and the resulting recharge. More research would be required to develop these relationships, but this work would likely involve the use of the wetting front depth. The model could also be revised to contain a better development of moisture content variations. This development could include a more sophisticated equation or the use of actual data as input to the model.
Clearly, there are many factors that affect calculations of recharge from infiltration. This model is a somewhat simplified application, but it still has value and will be included in the future groundwater modeling work at the BP facility. If nothing else, the author has certainly come to appreciate the complexity of developing soil moisture balance relationships.
Equations from Dingman's Physical Hydrology are in brackets.