This region was selected because it did include the Richmond County proposed site and because the region is small enough to enable manipulation in the assigned computer file space. The following analysis can be conducted with any other part of North Carolina just as easily (however, there is currently no LULC data for the Charlotte map sheet).
The Arc/Info command "clip" was used to extract data that did not fall in the study zone. Prior to this, all of the data coverages were converted into an Albers projection. This was done so that the data would be compatible and layers could be superimposed to create new coverages. The Methods Section describes this procedure in greater detail.
Creating "Extraction" Coverages:
Now that the data coverages are compatible and the right size we are ready to create "extraction" covers. These extraction covers use the assumption that at the beginning of the project all of the study area is viable site area. Each of these extraction coverages reduces this viable area. Thus after, all of the extraction coverages have been created and superimposed, the resulting uncovered area is the only remaining viable area.
Road Coverage with 300 meter buffer:
This coverage was created by adding a 300 meter buffer to each side of each road through the arc command "buffer". The resulting coverage is a set of polygons around the road describing the area that is non-viable due to the road proximity constraint.
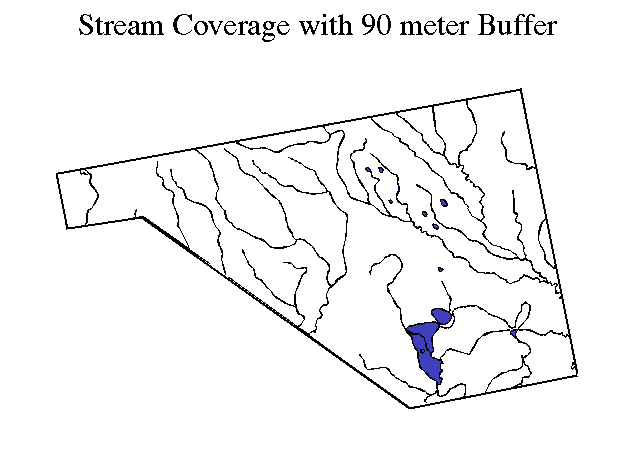
Stream Coverage with 90 meter buffer:
This coverage was created similarly to the road coverage by adding a 90 meter buffer to each side of each stream through the arc command "buffer". The resulting coverage is a set of polygons around the stream describing the area that is non-viable due to the road proximity constraint.
Wetland Coverage:
This coverage illustrates where a landfill cannot be positioned because of the wetland constrant. This coverage was created by selecting the LULC polygons whose land use were described as "Wetland" or "Water". This includes all water bodies in addition to forested and non-forested wetlands.
Urban Coverage:
This coverage illustrates where a landfill cannot be positioned because of urban development. This coverage was created by selecting the LULC polygons whose land use were described as "Urban or Built-up Land". This includes residential, commercial, and industrial areas.
Flood Prone Coverage:
The regulatory constraint corresponding to propensity to flooding states that a landfill cannot be sited within the 100 year flood plain of a river. Since data was not available showing the 100 year flood plain of rivers, this coverage was created using the STATSGO component variable flood frequency. All map units containing significant components with a flood frequency of greater than "none" (such as "occasional", "frequent") were selected and converted into this coverage.
Now we have a coverage of each constraint that corresponds to the non-viable area due to that constraint.
By superimposing each of the constraint coverages we are able to see which land is still viable (reamining white area).
Optimize Remaining Sites:
The above coverage illustrates that the selected constraints that were used left a large portion of area that still has siting potential. However, it is obvious that some of these sites are better candidates than others. The variable that I used to determine which of the remaining sites were optimal was the clay content of the soil.
The clay content of the soil is an important parameter in landfill siting because landfills usually use clay as a construction material. Therefore, it is cost effective to choose a site that already has clay that can be used. In addition, clay has a very low permeability and thus tends to inhibit the migration of pollutants.
Very Low Clay Coverage:
From the above arguments it is clear that it is less desirable to build a landfill on land with very littly clay. Thus, another coverage was created to show the land areas that had very little clay (< 10 %). This coverage was created by using the STATSGO layer variables "low estimate of clay content" and "high estimate of clay content". Because each map unit contained many components and many more layers, these mapunits were selected with somewhat of an "eyeball estimate". The map units with a average clay content of approximately less than 10 % were selected and converted into a coverage. The following image shows the result of superimposing this low clay coverage on the already created extraction coverages.
Medium Low Clay Coverage:
Another coverage was created by the same method as above that shows map units with clay content of between 10 and 30 %. This is another flexible constraint, and is created to show which of the remaining sites show the most potential.
Results:
The remaining white area on the preceding image shows the land area that shows the most potential for the construction of a low level hazardous waste landfill. From this image we see that the westernmost portion of the study area, which corresponds to the Richmond County site (selected by conventional methods), is a potential site. This suggests that the preceding analysis does have some merit (although further extraction restrictions need be applied for truly useful information).
Conclusions:
The results from the preceding project illustrate the impact that GIS can have on siting problems. By providing an unbiased methodology and the ability to optimize and change relevant variables, GIS is a useful tool in solving such problems. As more data becomes available, the usefulness and accuracy of this tool will only increase.