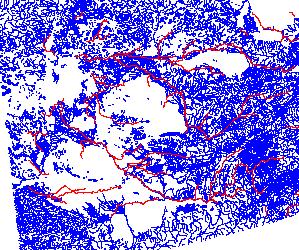
The next step was to use the Digital Chart of the World (DCW) CD Rom to get the streams of the region. The blue lines indicate the thousands of streams which were included in the DCW. The red lines show the streams which were selected from the DCW to be burned in the DEM.
Figure 6: Streams from the Digital Chart of the World
Edited this coverage took a very long time, but the coverage was compared to the European Union TACIS Program coverage. The EU TACIS Program coverage, shown below, was originally in a Transverse projection, and therefore had to converted from Transverse to Albers .
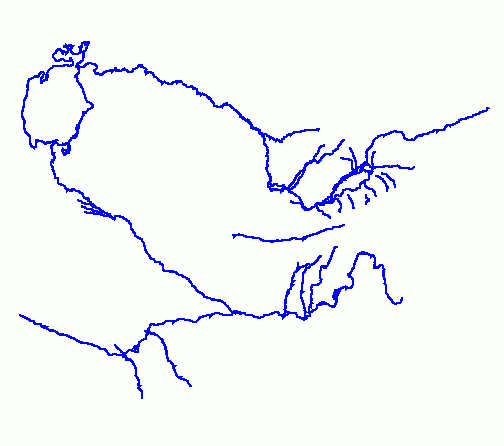
Figure7: European Union TACIS Program Coverage of Digitized Streams
The final coverage of streams to be burned in looked like this:
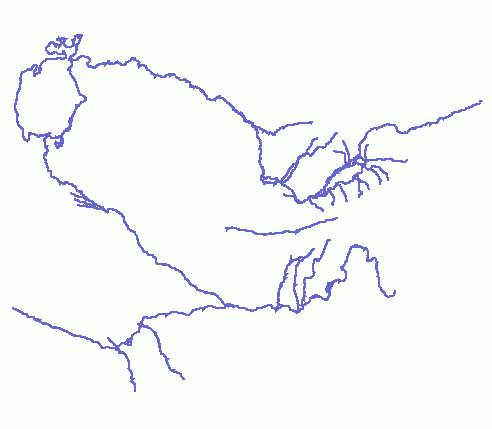
Figure8: Streams to be Burned In