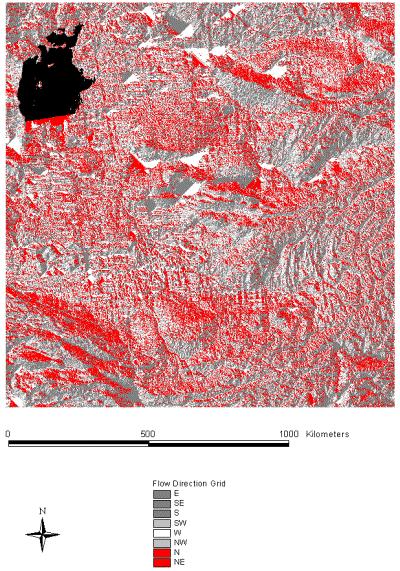
In order that water can "flow" across the landscape, any spurious pits have to be filled in. Then, the flowdirection grid can be detrmined. The flowdirection function in grid assigns to each cell a number corresponding to which of the 8 neighbouring cells lies on the path of steepest descent. The cells flow to their nearest neighbour along 1 of 8 compass directions labelled as East = 1, SE = 2, S = 4, SW=8, W=16, NW=32, N=64, NE=128.
Figure 11: Flowdirection Grid
The histogram shown below demonstrates that most of the flow is west bound and north bound.
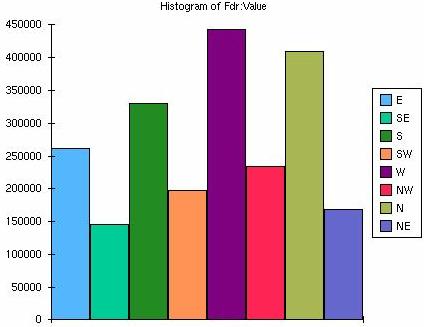
Figure 12: Histogram of Flow Direction
The flowaccumulation grid, shown here, counts all the cells upstream of a given cell.
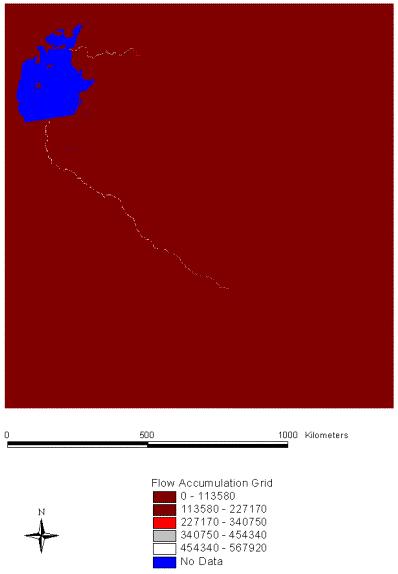
Figure 13: Flowaccumulation
Next a grid of the streams was created. Different results are obtained depending on the threshold value of flow accumulation used. In this case, a threshold of 3000 was used. Then the watershed delineation was created by locating the outlet cell at the bottom end of each watershed. This figure shows the delineated streams and watersheds in an Albers Projection.
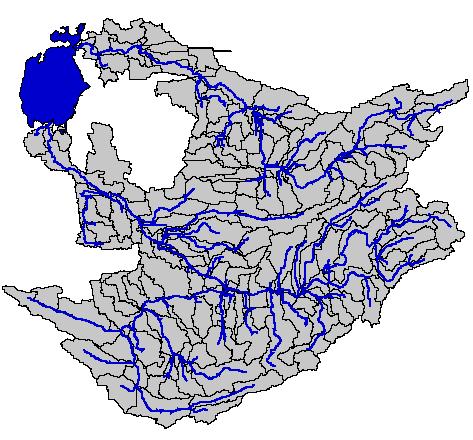
Figure 14: Stream and Watershed Delineation
As shown below, the delineated streams coincide almost perfectly with the streams from the EU TACIS Program.
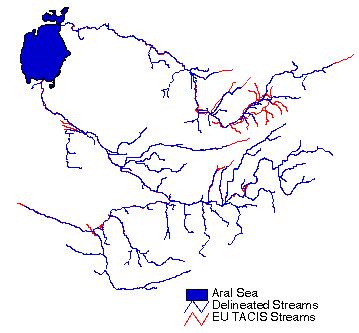
Figure 15: Comparison of the Delineated and EU TACIS Streams